Immigrants from Morocco vs Carpatho Rusyn 6th Grade
COMPARE
Immigrants from Morocco
Carpatho Rusyn
6th Grade
6th Grade Comparison
Immigrants from Morocco
Carpatho Rusyns
96.7%
6TH GRADE
6.2/ 100
METRIC RATING
220th/ 347
METRIC RANK
98.1%
6TH GRADE
100.0/ 100
METRIC RATING
14th/ 347
METRIC RANK
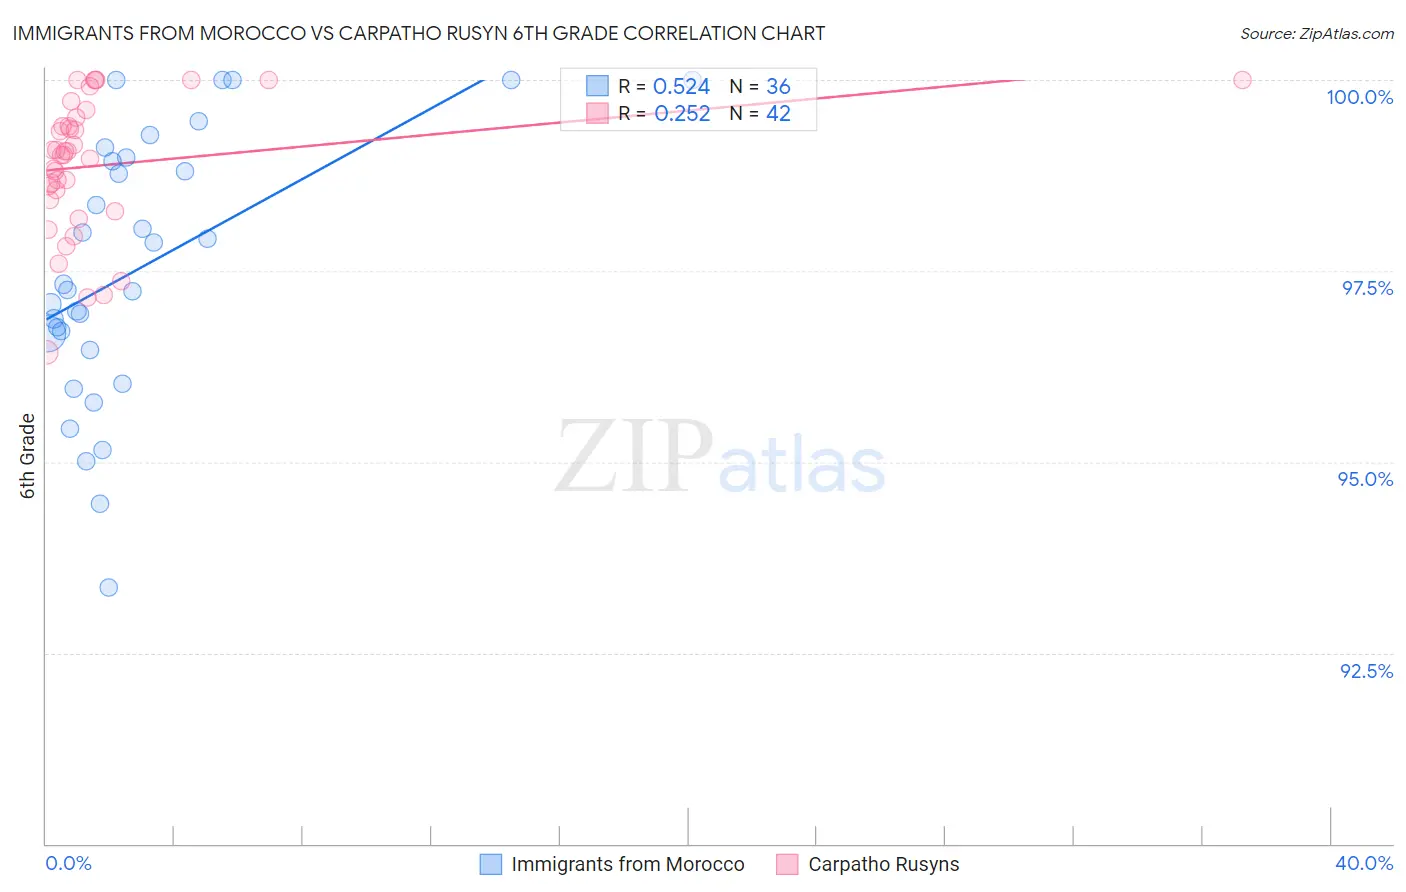
Immigrants from Morocco vs Carpatho Rusyn 6th Grade Correlation Chart
The statistical analysis conducted on geographies consisting of 178,910,634 people shows a substantial positive correlation between the proportion of Immigrants from Morocco and percentage of population with at least 6th grade education in the United States with a correlation coefficient (R) of 0.524 and weighted average of 96.7%. Similarly, the statistical analysis conducted on geographies consisting of 58,871,690 people shows a weak positive correlation between the proportion of Carpatho Rusyns and percentage of population with at least 6th grade education in the United States with a correlation coefficient (R) of 0.252 and weighted average of 98.1%, a difference of 1.4%.
6th Grade Correlation Summary
| Measurement | Immigrants from Morocco | Carpatho Rusyn |
| Minimum | 93.4% | 96.4% |
| Maximum | 100.0% | 100.0% |
| Range | 6.6% | 3.6% |
| Mean | 97.5% | 98.9% |
| Median | 97.3% | 99.0% |
| Interquartile 25% (IQ1) | 96.6% | 98.4% |
| Interquartile 75% (IQ3) | 99.0% | 99.5% |
| Interquartile Range (IQR) | 2.4% | 1.1% |
| Standard Deviation (Sample) | 1.7% | 0.89% |
| Standard Deviation (Population) | 1.7% | 0.88% |
Similar Demographics by 6th Grade
Demographics Similar to Immigrants from Morocco by 6th Grade
In terms of 6th grade, the demographic groups most similar to Immigrants from Morocco are Tongan (96.7%, a difference of 0.0%), Costa Rican (96.8%, a difference of 0.010%), Immigrants from Syria (96.7%, a difference of 0.010%), Liberian (96.8%, a difference of 0.020%), and Navajo (96.8%, a difference of 0.020%).
| Demographics | Rating | Rank | 6th Grade |
| Immigrants | Sudan | 8.7 /100 | #213 | Tragic 96.8% |
| Portuguese | 8.2 /100 | #214 | Tragic 96.8% |
| Sierra Leoneans | 8.0 /100 | #215 | Tragic 96.8% |
| Paiute | 7.8 /100 | #216 | Tragic 96.8% |
| Liberians | 7.5 /100 | #217 | Tragic 96.8% |
| Navajo | 7.3 /100 | #218 | Tragic 96.8% |
| Costa Ricans | 6.8 /100 | #219 | Tragic 96.8% |
| Immigrants | Morocco | 6.2 /100 | #220 | Tragic 96.7% |
| Tongans | 6.1 /100 | #221 | Tragic 96.7% |
| Immigrants | Syria | 5.9 /100 | #222 | Tragic 96.7% |
| Bahamians | 4.8 /100 | #223 | Tragic 96.7% |
| Immigrants | Southern Europe | 4.4 /100 | #224 | Tragic 96.7% |
| Immigrants | Pakistan | 4.4 /100 | #225 | Tragic 96.7% |
| Immigrants | Panama | 4.2 /100 | #226 | Tragic 96.7% |
| Immigrants | Western Asia | 4.1 /100 | #227 | Tragic 96.7% |
Demographics Similar to Carpatho Rusyns by 6th Grade
In terms of 6th grade, the demographic groups most similar to Carpatho Rusyns are Tlingit-Haida (98.1%, a difference of 0.010%), Inupiat (98.1%, a difference of 0.010%), Scottish (98.1%, a difference of 0.010%), Alaskan Athabascan (98.1%, a difference of 0.020%), and Polish (98.1%, a difference of 0.020%).
| Demographics | Rating | Rank | 6th Grade |
| Germans | 100.0 /100 | #7 | Exceptional 98.2% |
| Slovaks | 100.0 /100 | #8 | Exceptional 98.2% |
| Slovenes | 100.0 /100 | #9 | Exceptional 98.2% |
| Swedes | 100.0 /100 | #10 | Exceptional 98.2% |
| English | 100.0 /100 | #11 | Exceptional 98.1% |
| Alaskan Athabascans | 100.0 /100 | #12 | Exceptional 98.1% |
| Tlingit-Haida | 100.0 /100 | #13 | Exceptional 98.1% |
| Carpatho Rusyns | 100.0 /100 | #14 | Exceptional 98.1% |
| Inupiat | 100.0 /100 | #15 | Exceptional 98.1% |
| Scottish | 100.0 /100 | #16 | Exceptional 98.1% |
| Poles | 100.0 /100 | #17 | Exceptional 98.1% |
| Pennsylvania Germans | 100.0 /100 | #18 | Exceptional 98.1% |
| Irish | 100.0 /100 | #19 | Exceptional 98.1% |
| Finns | 100.0 /100 | #20 | Exceptional 98.1% |
| Lithuanians | 100.0 /100 | #21 | Exceptional 98.1% |