Immigrants from Ethiopia vs Yakama GED/Equivalency
COMPARE
Immigrants from Ethiopia
Yakama
GED/Equivalency
GED/Equivalency Comparison
Immigrants from Ethiopia
Yakama
86.0%
GED/EQUIVALENCY
61.2/ 100
METRIC RATING
169th/ 347
METRIC RANK
74.5%
GED/EQUIVALENCY
0.0/ 100
METRIC RATING
347th/ 347
METRIC RANK
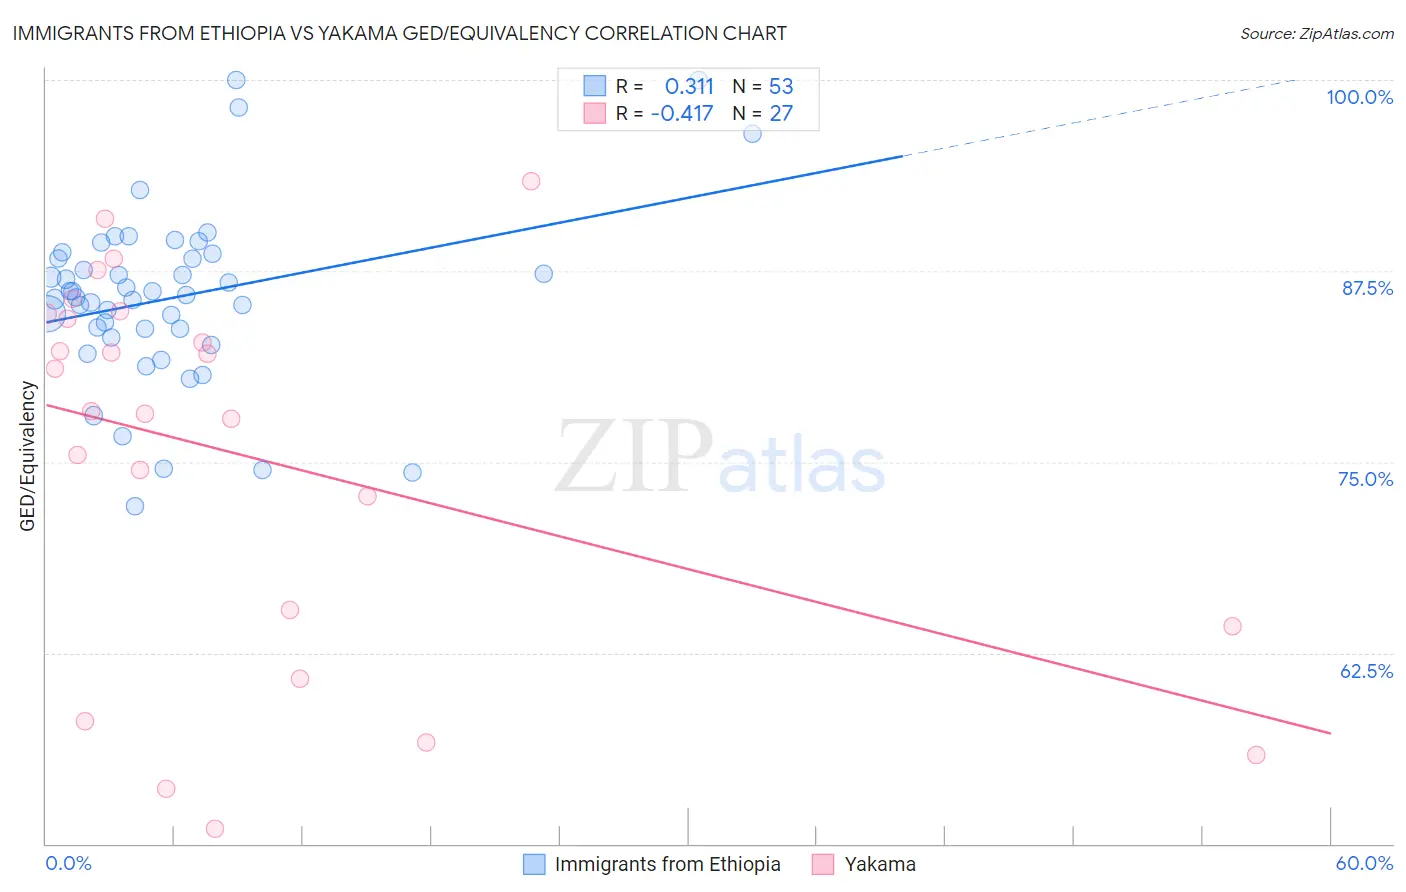
Immigrants from Ethiopia vs Yakama GED/Equivalency Correlation Chart
The statistical analysis conducted on geographies consisting of 211,528,629 people shows a mild positive correlation between the proportion of Immigrants from Ethiopia and percentage of population with at least ged/equivalency education in the United States with a correlation coefficient (R) of 0.311 and weighted average of 86.0%. Similarly, the statistical analysis conducted on geographies consisting of 19,923,144 people shows a moderate negative correlation between the proportion of Yakama and percentage of population with at least ged/equivalency education in the United States with a correlation coefficient (R) of -0.417 and weighted average of 74.5%, a difference of 15.4%.
GED/Equivalency Correlation Summary
| Measurement | Immigrants from Ethiopia | Yakama |
| Minimum | 72.1% | 51.0% |
| Maximum | 100.0% | 93.3% |
| Range | 27.9% | 42.4% |
| Mean | 85.8% | 75.3% |
| Median | 85.9% | 78.4% |
| Interquartile 25% (IQ1) | 83.4% | 64.2% |
| Interquartile 75% (IQ3) | 88.5% | 84.7% |
| Interquartile Range (IQR) | 5.0% | 20.4% |
| Standard Deviation (Sample) | 5.7% | 12.5% |
| Standard Deviation (Population) | 5.7% | 12.2% |
Similar Demographics by GED/Equivalency
Demographics Similar to Immigrants from Ethiopia by GED/Equivalency
In terms of ged/equivalency, the demographic groups most similar to Immigrants from Ethiopia are Sierra Leonean (86.0%, a difference of 0.010%), Afghan (85.9%, a difference of 0.030%), Ethiopian (86.0%, a difference of 0.050%), Alsatian (86.0%, a difference of 0.070%), and Immigrants from Albania (86.0%, a difference of 0.070%).
| Demographics | Rating | Rank | GED/Equivalency |
| Immigrants | Iraq | 68.1 /100 | #162 | Good 86.1% |
| Ugandans | 66.3 /100 | #163 | Good 86.1% |
| Venezuelans | 65.5 /100 | #164 | Good 86.0% |
| Alsatians | 64.3 /100 | #165 | Good 86.0% |
| Immigrants | Albania | 64.2 /100 | #166 | Good 86.0% |
| Ethiopians | 63.7 /100 | #167 | Good 86.0% |
| Sierra Leoneans | 61.8 /100 | #168 | Good 86.0% |
| Immigrants | Ethiopia | 61.2 /100 | #169 | Good 86.0% |
| Afghans | 59.7 /100 | #170 | Average 85.9% |
| Immigrants | Chile | 57.3 /100 | #171 | Average 85.9% |
| Bermudans | 55.1 /100 | #172 | Average 85.8% |
| Immigrants | Venezuela | 50.7 /100 | #173 | Average 85.8% |
| Ottawa | 50.0 /100 | #174 | Average 85.8% |
| Immigrants | Bolivia | 49.8 /100 | #175 | Average 85.8% |
| Immigrants | Eastern Africa | 47.7 /100 | #176 | Average 85.7% |
Demographics Similar to Yakama by GED/Equivalency
In terms of ged/equivalency, the demographic groups most similar to Yakama are Houma (75.0%, a difference of 0.61%), Immigrants from Mexico (75.7%, a difference of 1.6%), Spanish American Indian (76.3%, a difference of 2.5%), Immigrants from Central America (76.4%, a difference of 2.5%), and Pima (76.4%, a difference of 2.6%).
| Demographics | Rating | Rank | GED/Equivalency |
| Salvadorans | 0.0 /100 | #333 | Tragic 78.6% |
| Guatemalans | 0.0 /100 | #334 | Tragic 78.5% |
| Immigrants | Latin America | 0.0 /100 | #335 | Tragic 78.5% |
| Immigrants | Dominican Republic | 0.0 /100 | #336 | Tragic 78.0% |
| Immigrants | Yemen | 0.0 /100 | #337 | Tragic 77.9% |
| Immigrants | Guatemala | 0.0 /100 | #338 | Tragic 77.9% |
| Immigrants | El Salvador | 0.0 /100 | #339 | Tragic 77.6% |
| Tohono O'odham | 0.0 /100 | #340 | Tragic 77.5% |
| Mexicans | 0.0 /100 | #341 | Tragic 77.4% |
| Pima | 0.0 /100 | #342 | Tragic 76.4% |
| Immigrants | Central America | 0.0 /100 | #343 | Tragic 76.4% |
| Spanish American Indians | 0.0 /100 | #344 | Tragic 76.3% |
| Immigrants | Mexico | 0.0 /100 | #345 | Tragic 75.7% |
| Houma | 0.0 /100 | #346 | Tragic 75.0% |
| Yakama | 0.0 /100 | #347 | Tragic 74.5% |