Immigrants from Moldova vs Houma Currently Married
COMPARE
Immigrants from Moldova
Houma
Currently Married
Currently Married Comparison
Immigrants from Moldova
Houma
48.5%
CURRENTLY MARRIED
98.7/ 100
METRIC RATING
54th/ 347
METRIC RANK
45.5%
CURRENTLY MARRIED
7.2/ 100
METRIC RATING
211th/ 347
METRIC RANK
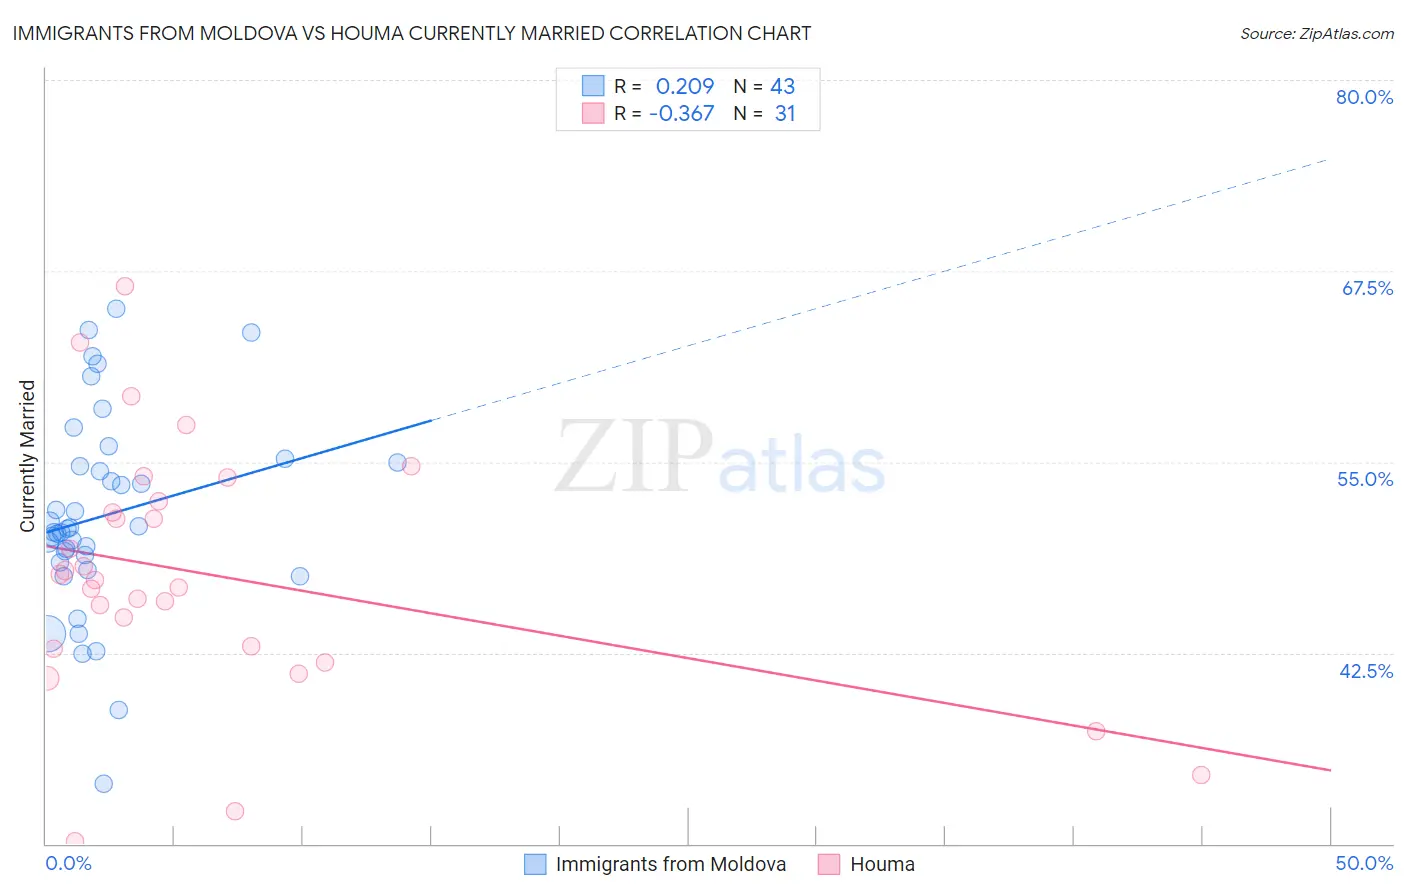
Immigrants from Moldova vs Houma Currently Married Correlation Chart
The statistical analysis conducted on geographies consisting of 124,399,411 people shows a weak positive correlation between the proportion of Immigrants from Moldova and percentage of population currently married in the United States with a correlation coefficient (R) of 0.209 and weighted average of 48.5%. Similarly, the statistical analysis conducted on geographies consisting of 36,796,778 people shows a mild negative correlation between the proportion of Houma and percentage of population currently married in the United States with a correlation coefficient (R) of -0.367 and weighted average of 45.5%, a difference of 6.4%.
Currently Married Correlation Summary
| Measurement | Immigrants from Moldova | Houma |
| Minimum | 33.9% | 30.2% |
| Maximum | 65.0% | 66.5% |
| Range | 31.1% | 36.3% |
| Mean | 51.5% | 47.6% |
| Median | 50.6% | 47.3% |
| Interquartile 25% (IQ1) | 48.4% | 42.8% |
| Interquartile 75% (IQ3) | 55.0% | 52.4% |
| Interquartile Range (IQR) | 6.6% | 9.6% |
| Standard Deviation (Sample) | 6.6% | 8.2% |
| Standard Deviation (Population) | 6.5% | 8.1% |
Similar Demographics by Currently Married
Demographics Similar to Immigrants from Moldova by Currently Married
In terms of currently married, the demographic groups most similar to Immigrants from Moldova are Immigrants from North Macedonia (48.5%, a difference of 0.0%), Latvian (48.5%, a difference of 0.0%), Immigrants from Netherlands (48.5%, a difference of 0.030%), Immigrants from Austria (48.5%, a difference of 0.060%), and French (48.4%, a difference of 0.080%).
| Demographics | Rating | Rank | Currently Married |
| Northern Europeans | 99.2 /100 | #47 | Exceptional 48.7% |
| Austrians | 99.2 /100 | #48 | Exceptional 48.7% |
| Bhutanese | 99.1 /100 | #49 | Exceptional 48.6% |
| Iranians | 99.0 /100 | #50 | Exceptional 48.6% |
| Whites/Caucasians | 99.0 /100 | #51 | Exceptional 48.6% |
| Russians | 98.9 /100 | #52 | Exceptional 48.6% |
| Immigrants | Austria | 98.8 /100 | #53 | Exceptional 48.5% |
| Immigrants | Moldova | 98.7 /100 | #54 | Exceptional 48.5% |
| Immigrants | North Macedonia | 98.7 /100 | #55 | Exceptional 48.5% |
| Latvians | 98.7 /100 | #56 | Exceptional 48.5% |
| Immigrants | Netherlands | 98.6 /100 | #57 | Exceptional 48.5% |
| French | 98.6 /100 | #58 | Exceptional 48.4% |
| Immigrants | Ireland | 98.5 /100 | #59 | Exceptional 48.4% |
| Immigrants | Romania | 98.5 /100 | #60 | Exceptional 48.4% |
| Romanians | 98.5 /100 | #61 | Exceptional 48.4% |
Demographics Similar to Houma by Currently Married
In terms of currently married, the demographic groups most similar to Houma are Marshallese (45.5%, a difference of 0.010%), Alaska Native (45.5%, a difference of 0.040%), Dutch West Indian (45.5%, a difference of 0.080%), German Russian (45.5%, a difference of 0.080%), and Uruguayan (45.6%, a difference of 0.090%).
| Demographics | Rating | Rank | Currently Married |
| Immigrants | Spain | 11.6 /100 | #204 | Poor 45.8% |
| South American Indians | 11.5 /100 | #205 | Poor 45.8% |
| Immigrants | Immigrants | 11.2 /100 | #206 | Poor 45.8% |
| Immigrants | South America | 10.8 /100 | #207 | Poor 45.7% |
| Alsatians | 10.8 /100 | #208 | Poor 45.7% |
| Immigrants | Micronesia | 8.8 /100 | #209 | Tragic 45.6% |
| Uruguayans | 7.9 /100 | #210 | Tragic 45.6% |
| Houma | 7.2 /100 | #211 | Tragic 45.5% |
| Marshallese | 7.2 /100 | #212 | Tragic 45.5% |
| Alaska Natives | 7.0 /100 | #213 | Tragic 45.5% |
| Dutch West Indians | 6.7 /100 | #214 | Tragic 45.5% |
| German Russians | 6.7 /100 | #215 | Tragic 45.5% |
| Immigrants | Morocco | 5.5 /100 | #216 | Tragic 45.4% |
| Immigrants | Thailand | 5.1 /100 | #217 | Tragic 45.4% |
| Panamanians | 4.0 /100 | #218 | Tragic 45.3% |