Immigrants from Moldova vs Immigrants from Denmark 4th Grade
COMPARE
Immigrants from Moldova
Immigrants from Denmark
4th Grade
4th Grade Comparison
Immigrants from Moldova
Immigrants from Denmark
97.7%
4TH GRADE
82.4/ 100
METRIC RATING
145th/ 347
METRIC RANK
97.9%
4TH GRADE
98.7/ 100
METRIC RATING
90th/ 347
METRIC RANK
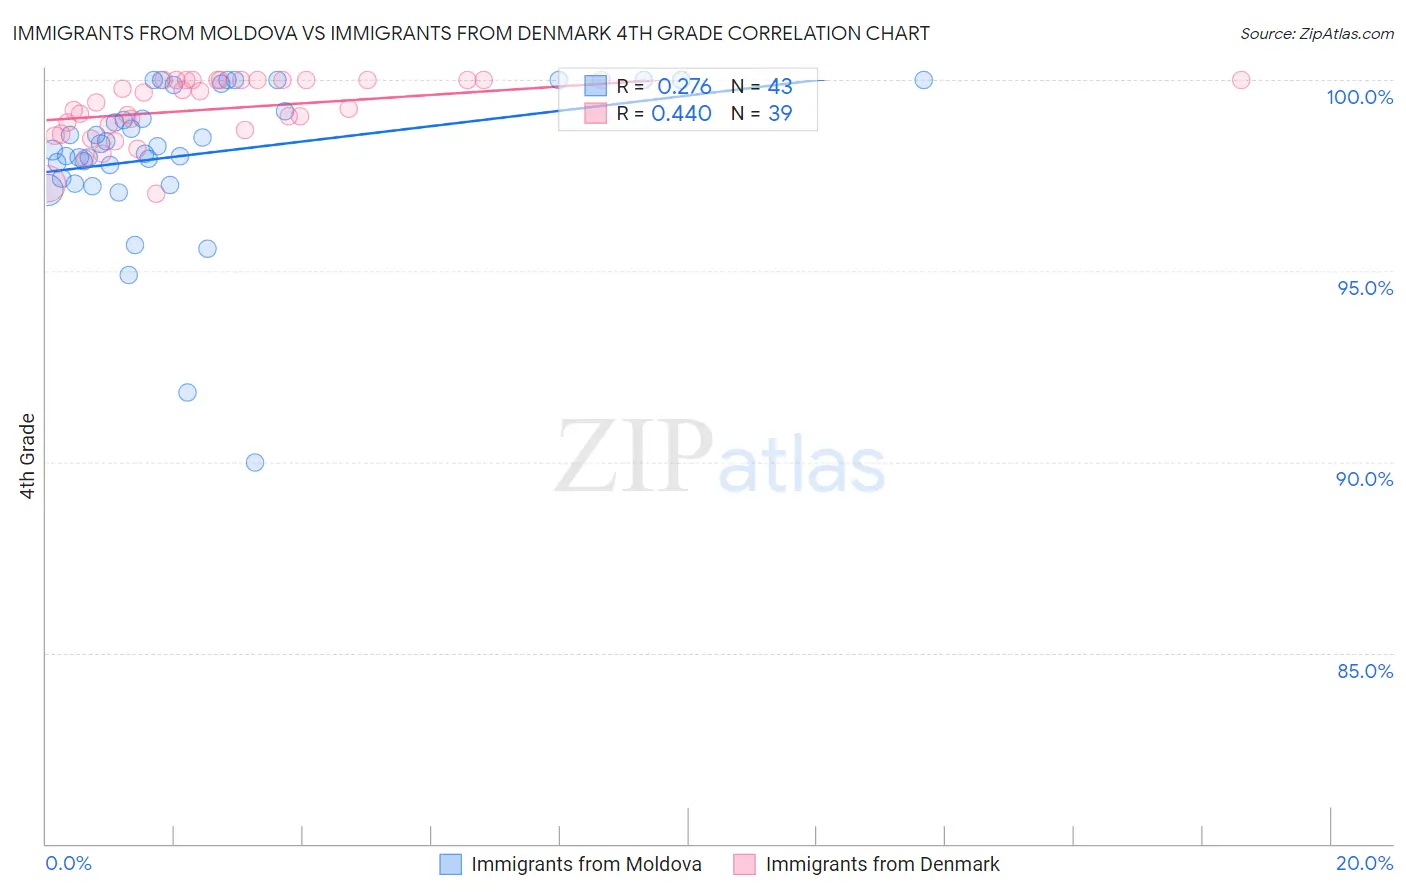
Immigrants from Moldova vs Immigrants from Denmark 4th Grade Correlation Chart
The statistical analysis conducted on geographies consisting of 124,398,501 people shows a weak positive correlation between the proportion of Immigrants from Moldova and percentage of population with at least 4th grade education in the United States with a correlation coefficient (R) of 0.276 and weighted average of 97.7%. Similarly, the statistical analysis conducted on geographies consisting of 136,428,049 people shows a moderate positive correlation between the proportion of Immigrants from Denmark and percentage of population with at least 4th grade education in the United States with a correlation coefficient (R) of 0.440 and weighted average of 97.9%, a difference of 0.27%.
4th Grade Correlation Summary
| Measurement | Immigrants from Moldova | Immigrants from Denmark |
| Minimum | 90.0% | 97.0% |
| Maximum | 100.0% | 100.0% |
| Range | 10.0% | 3.0% |
| Mean | 98.0% | 99.3% |
| Median | 98.3% | 99.4% |
| Interquartile 25% (IQ1) | 97.4% | 98.7% |
| Interquartile 75% (IQ3) | 99.9% | 100.0% |
| Interquartile Range (IQR) | 2.4% | 1.3% |
| Standard Deviation (Sample) | 2.0% | 0.82% |
| Standard Deviation (Population) | 2.0% | 0.81% |
Similar Demographics by 4th Grade
Demographics Similar to Immigrants from Moldova by 4th Grade
In terms of 4th grade, the demographic groups most similar to Immigrants from Moldova are Burmese (97.7%, a difference of 0.0%), Spaniard (97.7%, a difference of 0.0%), Filipino (97.7%, a difference of 0.010%), Immigrants from Greece (97.7%, a difference of 0.010%), and Immigrants from North Macedonia (97.7%, a difference of 0.010%).
| Demographics | Rating | Rank | 4th Grade |
| Blackfeet | 86.0 /100 | #138 | Excellent 97.7% |
| Seminole | 84.7 /100 | #139 | Excellent 97.7% |
| Filipinos | 84.0 /100 | #140 | Excellent 97.7% |
| Immigrants | Greece | 83.8 /100 | #141 | Excellent 97.7% |
| Immigrants | North Macedonia | 83.3 /100 | #142 | Excellent 97.7% |
| Burmese | 82.8 /100 | #143 | Excellent 97.7% |
| Spaniards | 82.7 /100 | #144 | Excellent 97.7% |
| Immigrants | Moldova | 82.4 /100 | #145 | Excellent 97.7% |
| Jordanians | 81.3 /100 | #146 | Excellent 97.7% |
| Ute | 80.6 /100 | #147 | Excellent 97.7% |
| Hopi | 80.6 /100 | #148 | Excellent 97.7% |
| Soviet Union | 77.8 /100 | #149 | Good 97.6% |
| Immigrants | Israel | 77.7 /100 | #150 | Good 97.6% |
| Alsatians | 77.2 /100 | #151 | Good 97.6% |
| Immigrants | South Central Asia | 76.2 /100 | #152 | Good 97.6% |
Demographics Similar to Immigrants from Denmark by 4th Grade
In terms of 4th grade, the demographic groups most similar to Immigrants from Denmark are Zimbabwean (97.9%, a difference of 0.0%), Immigrants from South Africa (97.9%, a difference of 0.0%), Delaware (97.9%, a difference of 0.0%), Immigrants from Sweden (97.9%, a difference of 0.0%), and Immigrants from Western Europe (97.9%, a difference of 0.0%).
| Demographics | Rating | Rank | 4th Grade |
| Immigrants | Belgium | 99.0 /100 | #83 | Exceptional 97.9% |
| Cypriots | 98.9 /100 | #84 | Exceptional 97.9% |
| Potawatomi | 98.9 /100 | #85 | Exceptional 97.9% |
| Immigrants | Australia | 98.8 /100 | #86 | Exceptional 97.9% |
| Zimbabweans | 98.8 /100 | #87 | Exceptional 97.9% |
| Immigrants | South Africa | 98.8 /100 | #88 | Exceptional 97.9% |
| Delaware | 98.8 /100 | #89 | Exceptional 97.9% |
| Immigrants | Denmark | 98.7 /100 | #90 | Exceptional 97.9% |
| Immigrants | Sweden | 98.7 /100 | #91 | Exceptional 97.9% |
| Immigrants | Western Europe | 98.7 /100 | #92 | Exceptional 97.9% |
| Immigrants | Ireland | 98.7 /100 | #93 | Exceptional 97.9% |
| Shoshone | 98.7 /100 | #94 | Exceptional 97.9% |
| Immigrants | Germany | 98.5 /100 | #95 | Exceptional 97.9% |
| Romanians | 98.4 /100 | #96 | Exceptional 97.9% |
| Cheyenne | 98.4 /100 | #97 | Exceptional 97.9% |