European vs Czech Associate's Degree
COMPARE
European
Czech
Associate's Degree
Associate's Degree Comparison
Europeans
Czechs
48.2%
ASSOCIATE'S DEGREE
89.0/ 100
METRIC RATING
135th/ 347
METRIC RANK
47.2%
ASSOCIATE'S DEGREE
72.2/ 100
METRIC RATING
153rd/ 347
METRIC RANK
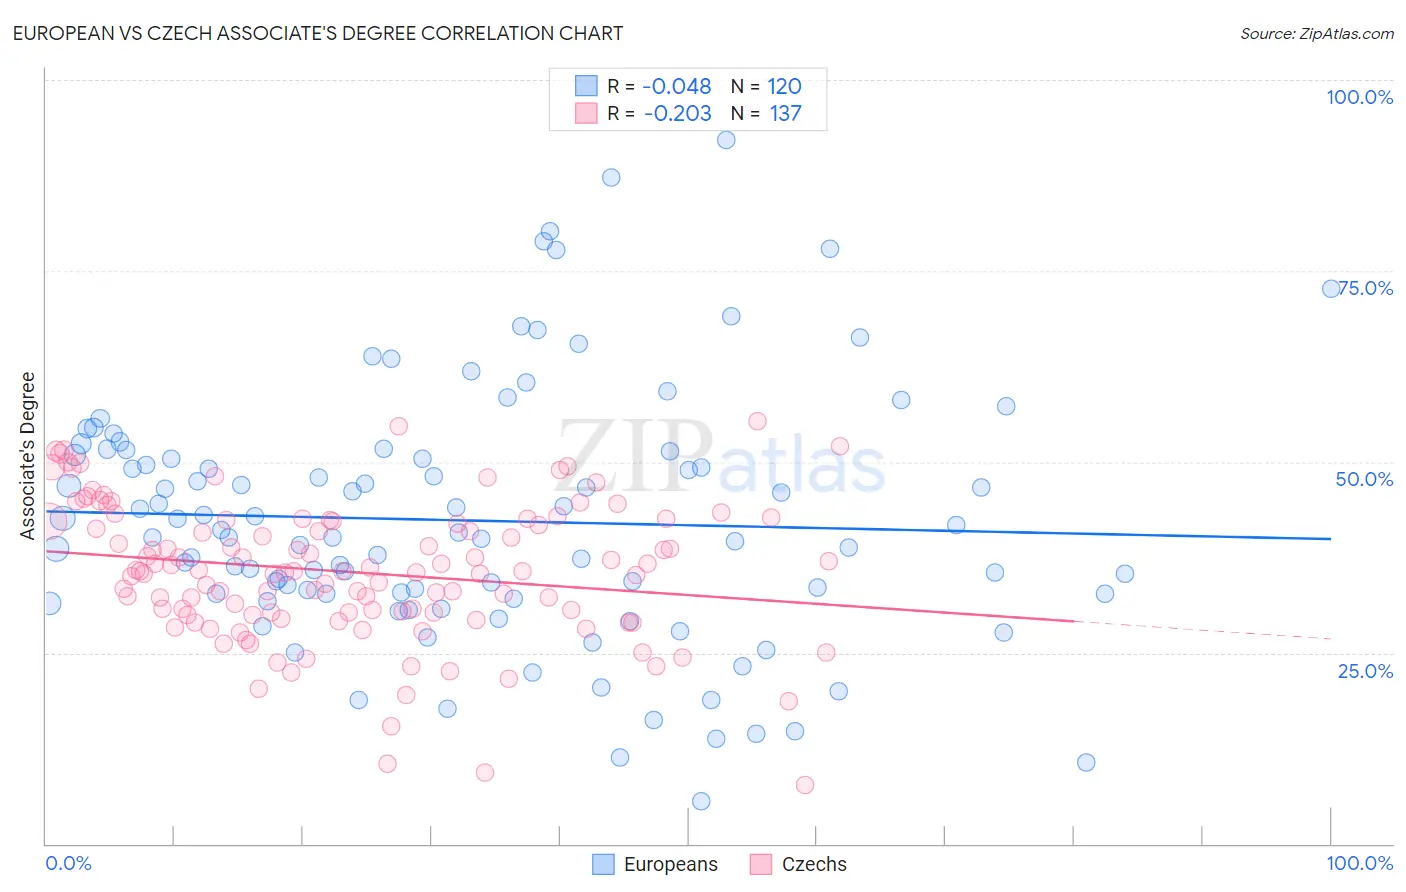
European vs Czech Associate's Degree Correlation Chart
The statistical analysis conducted on geographies consisting of 561,753,260 people shows no correlation between the proportion of Europeans and percentage of population with at least associate's degree education in the United States with a correlation coefficient (R) of -0.048 and weighted average of 48.2%. Similarly, the statistical analysis conducted on geographies consisting of 484,784,602 people shows a weak negative correlation between the proportion of Czechs and percentage of population with at least associate's degree education in the United States with a correlation coefficient (R) of -0.203 and weighted average of 47.2%, a difference of 2.1%.
Associate's Degree Correlation Summary
| Measurement | European | Czech |
| Minimum | 5.6% | 7.7% |
| Maximum | 92.2% | 55.4% |
| Range | 86.6% | 47.7% |
| Mean | 42.3% | 35.6% |
| Median | 40.4% | 35.7% |
| Interquartile 25% (IQ1) | 32.7% | 30.1% |
| Interquartile 75% (IQ3) | 51.2% | 42.3% |
| Interquartile Range (IQR) | 18.5% | 12.2% |
| Standard Deviation (Sample) | 16.5% | 9.1% |
| Standard Deviation (Population) | 16.4% | 9.0% |
Demographics Similar to Europeans and Czechs by Associate's Degree
In terms of associate's degree, the demographic groups most similar to Europeans are Moroccan (48.2%, a difference of 0.060%), Pakistani (48.1%, a difference of 0.18%), Immigrants from Eritrea (48.1%, a difference of 0.22%), Polish (48.0%, a difference of 0.29%), and Slovene (47.9%, a difference of 0.64%). Similarly, the demographic groups most similar to Czechs are Immigrants from Kenya (47.2%, a difference of 0.010%), Immigrants from Afghanistan (47.3%, a difference of 0.19%), Immigrants from North Macedonia (47.4%, a difference of 0.36%), Iraqi (47.4%, a difference of 0.38%), and Immigrants from Armenia (47.4%, a difference of 0.42%).
| Demographics | Rating | Rank | Associate's Degree |
| Moroccans | 89.3 /100 | #134 | Excellent 48.2% |
| Europeans | 89.0 /100 | #135 | Excellent 48.2% |
| Pakistanis | 88.0 /100 | #136 | Excellent 48.1% |
| Immigrants | Eritrea | 87.8 /100 | #137 | Excellent 48.1% |
| Poles | 87.3 /100 | #138 | Excellent 48.0% |
| Slovenes | 85.1 /100 | #139 | Excellent 47.9% |
| Immigrants | Southern Europe | 84.4 /100 | #140 | Excellent 47.8% |
| Taiwanese | 83.3 /100 | #141 | Excellent 47.7% |
| Sierra Leoneans | 82.9 /100 | #142 | Excellent 47.7% |
| Norwegians | 81.0 /100 | #143 | Excellent 47.6% |
| Slavs | 80.5 /100 | #144 | Excellent 47.6% |
| Canadians | 79.0 /100 | #145 | Good 47.5% |
| Immigrants | Sudan | 77.9 /100 | #146 | Good 47.4% |
| Danes | 77.3 /100 | #147 | Good 47.4% |
| South American Indians | 76.7 /100 | #148 | Good 47.4% |
| Immigrants | Armenia | 76.6 /100 | #149 | Good 47.4% |
| Iraqis | 76.2 /100 | #150 | Good 47.4% |
| Immigrants | North Macedonia | 76.0 /100 | #151 | Good 47.4% |
| Immigrants | Afghanistan | 74.3 /100 | #152 | Good 47.3% |
| Czechs | 72.2 /100 | #153 | Good 47.2% |
| Immigrants | Kenya | 72.1 /100 | #154 | Good 47.2% |