Immigrants from Moldova vs Arapaho Associate's Degree
COMPARE
Immigrants from Moldova
Arapaho
Associate's Degree
Associate's Degree Comparison
Immigrants from Moldova
Arapaho
50.2%
ASSOCIATE'S DEGREE
98.8/ 100
METRIC RATING
87th/ 347
METRIC RANK
36.7%
ASSOCIATE'S DEGREE
0.0/ 100
METRIC RATING
324th/ 347
METRIC RANK
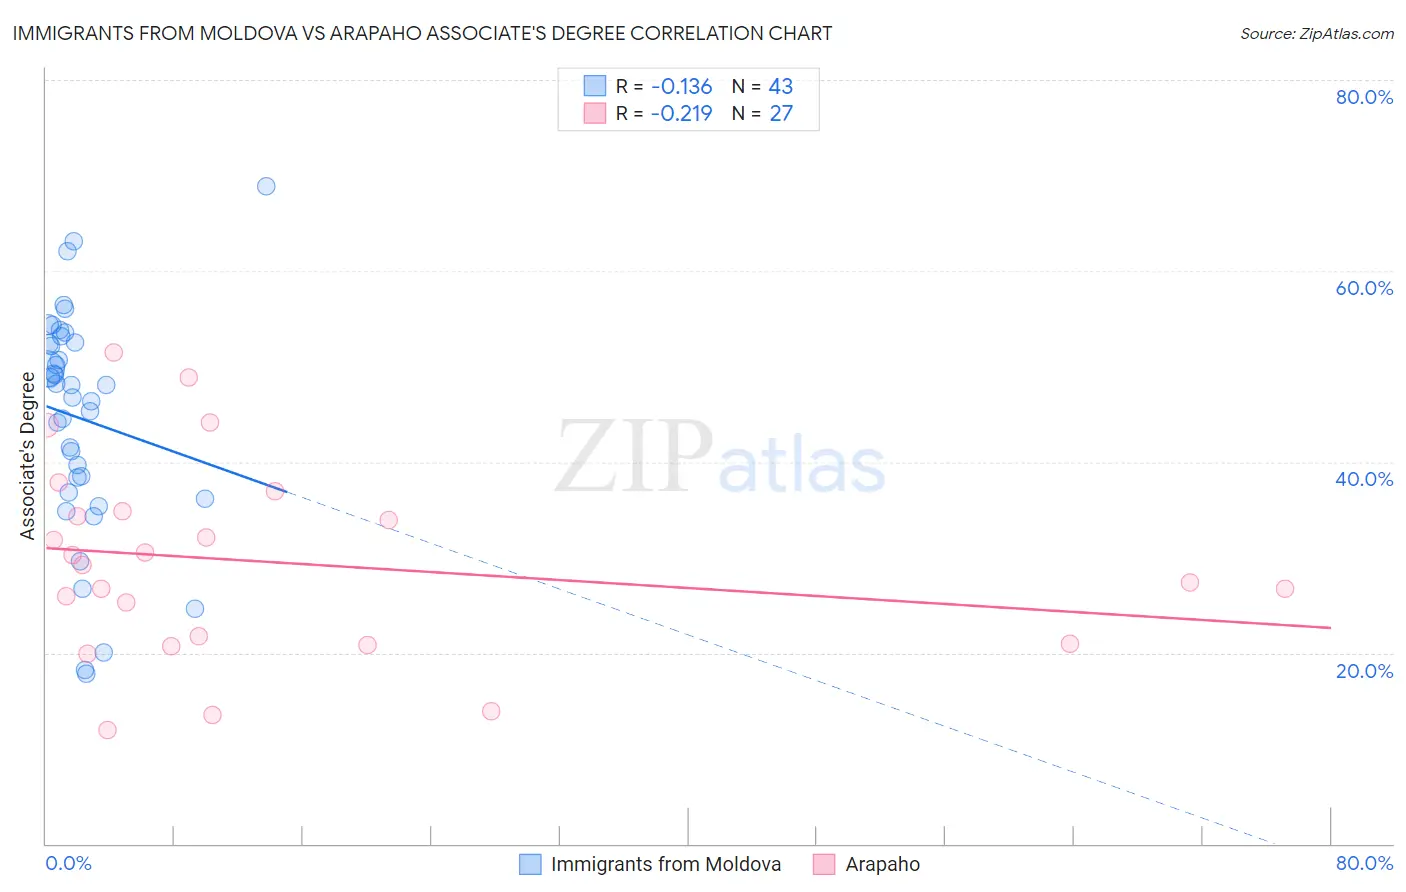
Immigrants from Moldova vs Arapaho Associate's Degree Correlation Chart
The statistical analysis conducted on geographies consisting of 124,396,308 people shows a poor negative correlation between the proportion of Immigrants from Moldova and percentage of population with at least associate's degree education in the United States with a correlation coefficient (R) of -0.136 and weighted average of 50.2%. Similarly, the statistical analysis conducted on geographies consisting of 29,779,330 people shows a weak negative correlation between the proportion of Arapaho and percentage of population with at least associate's degree education in the United States with a correlation coefficient (R) of -0.219 and weighted average of 36.7%, a difference of 36.6%.
Associate's Degree Correlation Summary
| Measurement | Immigrants from Moldova | Arapaho |
| Minimum | 17.8% | 11.9% |
| Maximum | 68.9% | 51.5% |
| Range | 51.1% | 39.6% |
| Mean | 44.5% | 29.5% |
| Median | 48.0% | 29.2% |
| Interquartile 25% (IQ1) | 36.7% | 21.0% |
| Interquartile 75% (IQ3) | 52.6% | 34.8% |
| Interquartile Range (IQR) | 15.8% | 13.8% |
| Standard Deviation (Sample) | 11.8% | 10.2% |
| Standard Deviation (Population) | 11.6% | 10.0% |
Similar Demographics by Associate's Degree
Demographics Similar to Immigrants from Moldova by Associate's Degree
In terms of associate's degree, the demographic groups most similar to Immigrants from Moldova are Immigrants from Canada (50.1%, a difference of 0.070%), Immigrants from Western Europe (50.1%, a difference of 0.080%), Immigrants from Ethiopia (50.1%, a difference of 0.080%), Immigrants from Croatia (50.2%, a difference of 0.12%), and Immigrants from Egypt (50.2%, a difference of 0.13%).
| Demographics | Rating | Rank | Associate's Degree |
| Armenians | 99.1 /100 | #80 | Exceptional 50.4% |
| Maltese | 99.1 /100 | #81 | Exceptional 50.4% |
| Greeks | 98.9 /100 | #82 | Exceptional 50.3% |
| Immigrants | Uzbekistan | 98.9 /100 | #83 | Exceptional 50.3% |
| Immigrants | Hungary | 98.9 /100 | #84 | Exceptional 50.2% |
| Immigrants | Egypt | 98.9 /100 | #85 | Exceptional 50.2% |
| Immigrants | Croatia | 98.9 /100 | #86 | Exceptional 50.2% |
| Immigrants | Moldova | 98.8 /100 | #87 | Exceptional 50.2% |
| Immigrants | Canada | 98.7 /100 | #88 | Exceptional 50.1% |
| Immigrants | Western Europe | 98.7 /100 | #89 | Exceptional 50.1% |
| Immigrants | Ethiopia | 98.7 /100 | #90 | Exceptional 50.1% |
| Immigrants | Western Asia | 98.7 /100 | #91 | Exceptional 50.1% |
| Immigrants | North America | 98.7 /100 | #92 | Exceptional 50.1% |
| Immigrants | Brazil | 98.5 /100 | #93 | Exceptional 50.0% |
| Laotians | 98.4 /100 | #94 | Exceptional 49.9% |
Demographics Similar to Arapaho by Associate's Degree
In terms of associate's degree, the demographic groups most similar to Arapaho are Menominee (36.7%, a difference of 0.11%), Immigrants from Cabo Verde (36.8%, a difference of 0.16%), Kiowa (36.5%, a difference of 0.67%), Dutch West Indian (36.5%, a difference of 0.69%), and Alaskan Athabascan (36.5%, a difference of 0.70%).
| Demographics | Rating | Rank | Associate's Degree |
| Yaqui | 0.0 /100 | #317 | Tragic 37.6% |
| Alaska Natives | 0.0 /100 | #318 | Tragic 37.5% |
| Fijians | 0.0 /100 | #319 | Tragic 37.4% |
| Cajuns | 0.0 /100 | #320 | Tragic 37.4% |
| Immigrants | Yemen | 0.0 /100 | #321 | Tragic 37.3% |
| Pennsylvania Germans | 0.0 /100 | #322 | Tragic 37.2% |
| Immigrants | Cabo Verde | 0.0 /100 | #323 | Tragic 36.8% |
| Arapaho | 0.0 /100 | #324 | Tragic 36.7% |
| Menominee | 0.0 /100 | #325 | Tragic 36.7% |
| Kiowa | 0.0 /100 | #326 | Tragic 36.5% |
| Dutch West Indians | 0.0 /100 | #327 | Tragic 36.5% |
| Alaskan Athabascans | 0.0 /100 | #328 | Tragic 36.5% |
| Paiute | 0.0 /100 | #329 | Tragic 36.4% |
| Apache | 0.0 /100 | #330 | Tragic 36.2% |
| Immigrants | Azores | 0.0 /100 | #331 | Tragic 35.6% |