Eastern European vs Alsatian Doctorate Degree
COMPARE
Eastern European
Alsatian
Doctorate Degree
Doctorate Degree Comparison
Eastern Europeans
Alsatians
2.8%
DOCTORATE DEGREE
100.0/ 100
METRIC RATING
16th/ 347
METRIC RANK
2.1%
DOCTORATE DEGREE
99.0/ 100
METRIC RATING
93rd/ 347
METRIC RANK
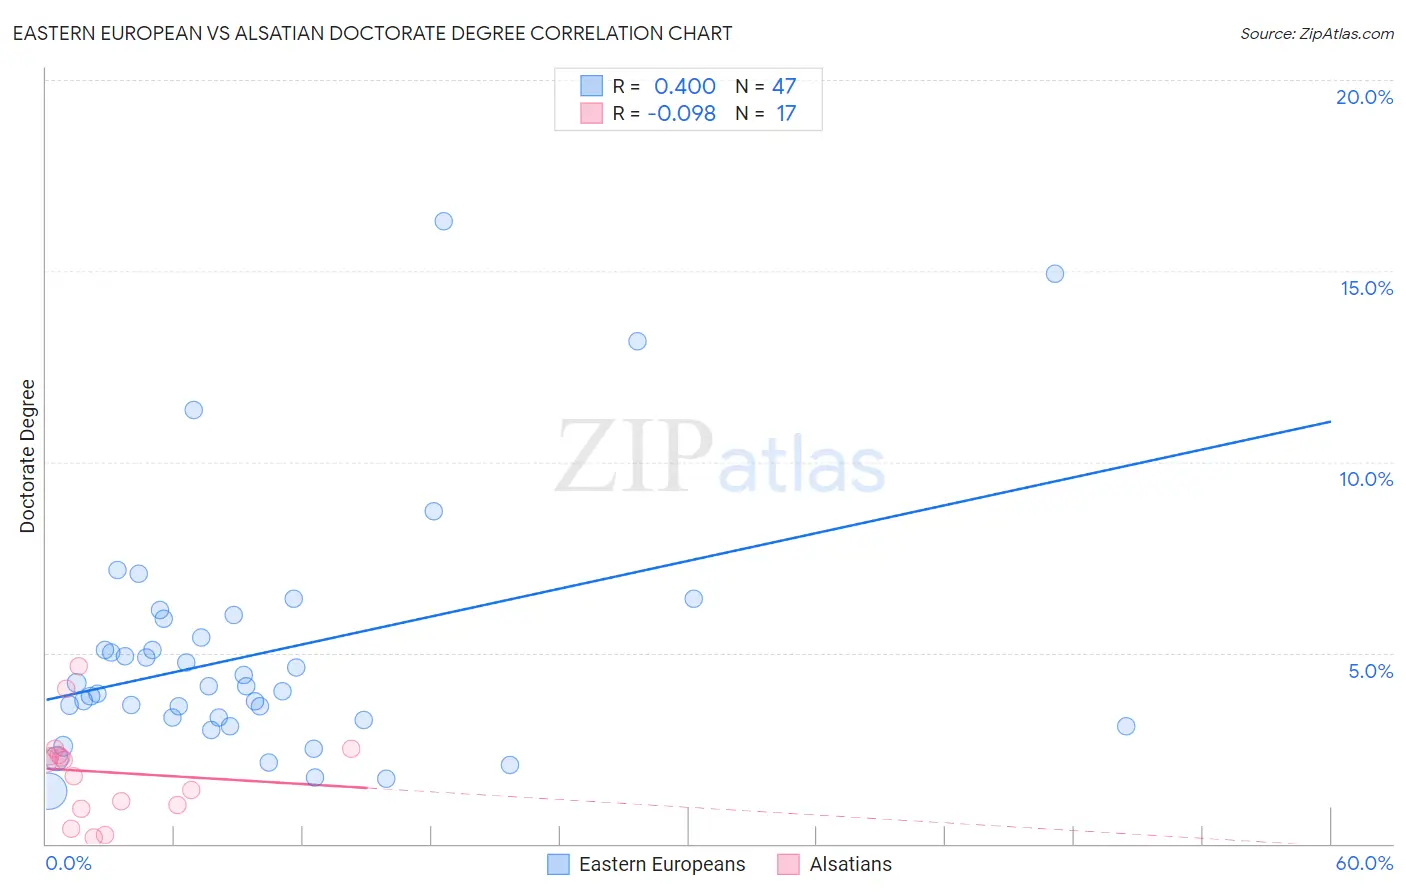
Eastern European vs Alsatian Doctorate Degree Correlation Chart
The statistical analysis conducted on geographies consisting of 454,559,491 people shows a moderate positive correlation between the proportion of Eastern Europeans and percentage of population with at least doctorate degree education in the United States with a correlation coefficient (R) of 0.400 and weighted average of 2.8%. Similarly, the statistical analysis conducted on geographies consisting of 82,508,744 people shows a slight negative correlation between the proportion of Alsatians and percentage of population with at least doctorate degree education in the United States with a correlation coefficient (R) of -0.098 and weighted average of 2.1%, a difference of 31.4%.
Doctorate Degree Correlation Summary
| Measurement | Eastern European | Alsatian |
| Minimum | 1.4% | 0.17% |
| Maximum | 16.3% | 4.7% |
| Range | 14.9% | 4.5% |
| Mean | 5.0% | 1.9% |
| Median | 4.1% | 2.2% |
| Interquartile 25% (IQ1) | 3.2% | 0.96% |
| Interquartile 75% (IQ3) | 5.9% | 2.4% |
| Interquartile Range (IQR) | 2.7% | 1.4% |
| Standard Deviation (Sample) | 3.2% | 1.2% |
| Standard Deviation (Population) | 3.2% | 1.2% |
Similar Demographics by Doctorate Degree
Demographics Similar to Eastern Europeans by Doctorate Degree
In terms of doctorate degree, the demographic groups most similar to Eastern Europeans are Immigrants from India (2.8%, a difference of 0.32%), Immigrants from Australia (2.8%, a difference of 0.70%), Immigrants from Sri Lanka (2.8%, a difference of 0.94%), Immigrants from Japan (2.8%, a difference of 1.3%), and Immigrants from France (2.9%, a difference of 1.5%).
| Demographics | Rating | Rank | Doctorate Degree |
| Immigrants | Iran | 100.0 /100 | #9 | Exceptional 3.0% |
| Immigrants | Eastern Asia | 100.0 /100 | #10 | Exceptional 3.0% |
| Indians (Asian) | 100.0 /100 | #11 | Exceptional 2.9% |
| Immigrants | Belgium | 100.0 /100 | #12 | Exceptional 2.9% |
| Immigrants | Sweden | 100.0 /100 | #13 | Exceptional 2.9% |
| Immigrants | France | 100.0 /100 | #14 | Exceptional 2.9% |
| Immigrants | India | 100.0 /100 | #15 | Exceptional 2.8% |
| Eastern Europeans | 100.0 /100 | #16 | Exceptional 2.8% |
| Immigrants | Australia | 100.0 /100 | #17 | Exceptional 2.8% |
| Immigrants | Sri Lanka | 100.0 /100 | #18 | Exceptional 2.8% |
| Immigrants | Japan | 100.0 /100 | #19 | Exceptional 2.8% |
| Immigrants | Hong Kong | 100.0 /100 | #20 | Exceptional 2.8% |
| Thais | 100.0 /100 | #21 | Exceptional 2.8% |
| Mongolians | 100.0 /100 | #22 | Exceptional 2.8% |
| Immigrants | Denmark | 100.0 /100 | #23 | Exceptional 2.8% |
Demographics Similar to Alsatians by Doctorate Degree
In terms of doctorate degree, the demographic groups most similar to Alsatians are Chilean (2.2%, a difference of 0.22%), Immigrants from Sudan (2.2%, a difference of 0.48%), Greek (2.1%, a difference of 0.64%), Immigrants from Romania (2.1%, a difference of 0.78%), and Immigrants from Scotland (2.2%, a difference of 0.95%).
| Demographics | Rating | Rank | Doctorate Degree |
| Egyptians | 99.4 /100 | #86 | Exceptional 2.2% |
| Immigrants | Zimbabwe | 99.4 /100 | #87 | Exceptional 2.2% |
| Immigrants | Nepal | 99.3 /100 | #88 | Exceptional 2.2% |
| British | 99.3 /100 | #89 | Exceptional 2.2% |
| Immigrants | Scotland | 99.2 /100 | #90 | Exceptional 2.2% |
| Immigrants | Sudan | 99.1 /100 | #91 | Exceptional 2.2% |
| Chileans | 99.1 /100 | #92 | Exceptional 2.2% |
| Alsatians | 99.0 /100 | #93 | Exceptional 2.1% |
| Greeks | 98.8 /100 | #94 | Exceptional 2.1% |
| Immigrants | Romania | 98.7 /100 | #95 | Exceptional 2.1% |
| Immigrants | Northern Africa | 98.4 /100 | #96 | Exceptional 2.1% |
| Immigrants | Eritrea | 98.4 /100 | #97 | Exceptional 2.1% |
| Armenians | 98.3 /100 | #98 | Exceptional 2.1% |
| Immigrants | Egypt | 98.2 /100 | #99 | Exceptional 2.1% |
| Immigrants | Eastern Europe | 98.2 /100 | #100 | Exceptional 2.1% |