Immigrants from Middle Africa vs Jamaican Unemployment Among Seniors over 75 years
COMPARE
Immigrants from Middle Africa
Jamaican
Unemployment Among Seniors over 75 years
Unemployment Among Seniors over 75 years Comparison
Immigrants from Middle Africa
Jamaicans
8.3%
UNEMPLOYMENT AMONG SENIORS OVER 75 YEARS
97.9/ 100
METRIC RATING
118th/ 347
METRIC RANK
9.5%
UNEMPLOYMENT AMONG SENIORS OVER 75 YEARS
0.2/ 100
METRIC RATING
274th/ 347
METRIC RANK
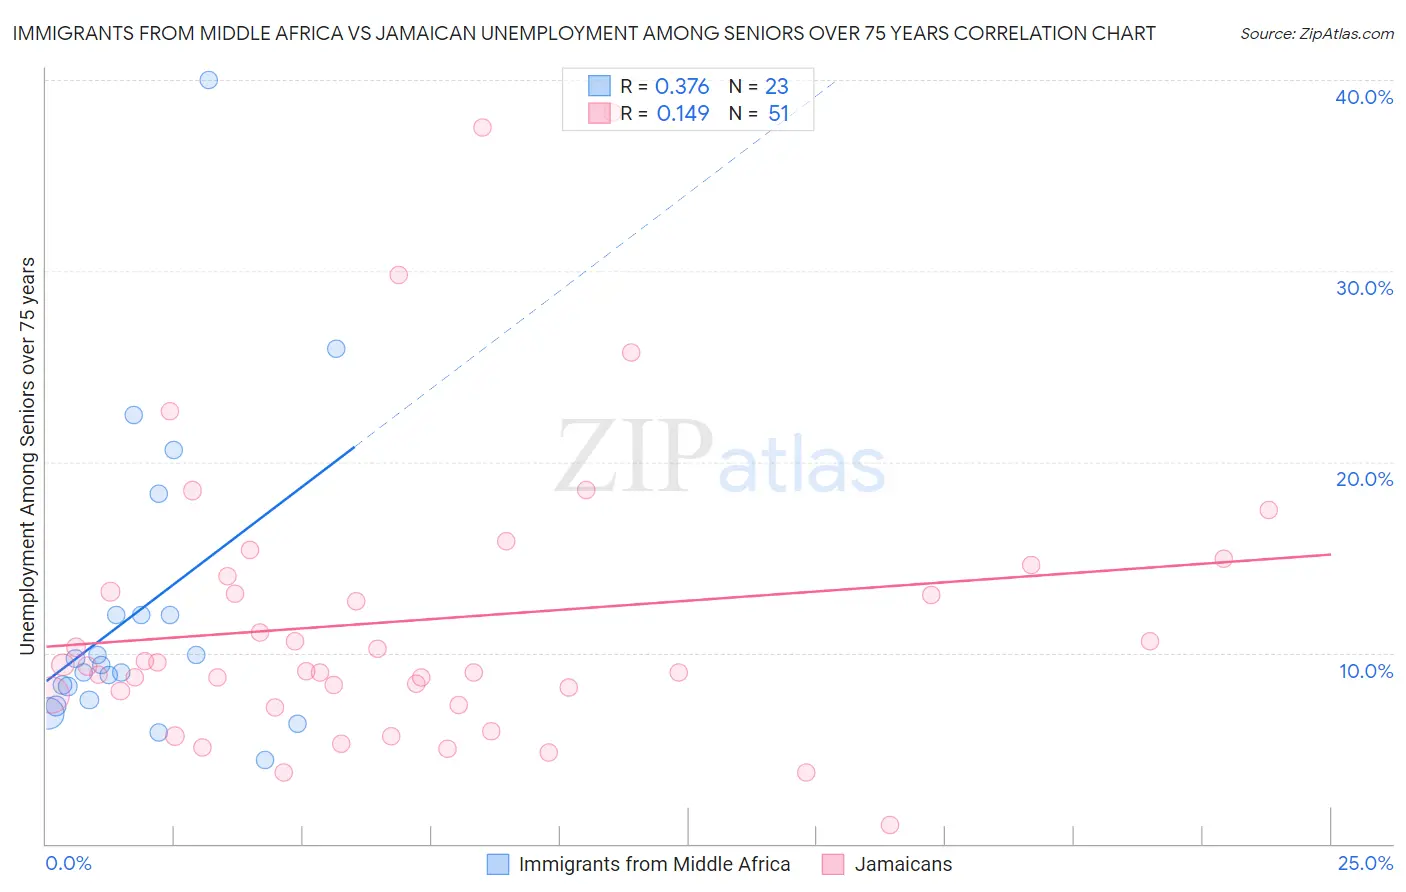
Immigrants from Middle Africa vs Jamaican Unemployment Among Seniors over 75 years Correlation Chart
The statistical analysis conducted on geographies consisting of 126,464,851 people shows a mild positive correlation between the proportion of Immigrants from Middle Africa and unemployment rate among seniors over the age of 75 in the United States with a correlation coefficient (R) of 0.376 and weighted average of 8.3%. Similarly, the statistical analysis conducted on geographies consisting of 192,345,752 people shows a poor positive correlation between the proportion of Jamaicans and unemployment rate among seniors over the age of 75 in the United States with a correlation coefficient (R) of 0.149 and weighted average of 9.5%, a difference of 14.0%.
Unemployment Among Seniors over 75 years Correlation Summary
| Measurement | Immigrants from Middle Africa | Jamaican |
| Minimum | 4.4% | 1.0% |
| Maximum | 40.0% | 38.3% |
| Range | 35.6% | 37.3% |
| Mean | 12.3% | 11.7% |
| Median | 9.3% | 9.3% |
| Interquartile 25% (IQ1) | 7.5% | 7.8% |
| Interquartile 75% (IQ3) | 12.0% | 14.0% |
| Interquartile Range (IQR) | 4.5% | 6.2% |
| Standard Deviation (Sample) | 8.2% | 7.7% |
| Standard Deviation (Population) | 8.0% | 7.6% |
Similar Demographics by Unemployment Among Seniors over 75 years
Demographics Similar to Immigrants from Middle Africa by Unemployment Among Seniors over 75 years
In terms of unemployment among seniors over 75 years, the demographic groups most similar to Immigrants from Middle Africa are Immigrants from Greece (8.3%, a difference of 0.040%), Immigrants from West Indies (8.3%, a difference of 0.18%), Sudanese (8.3%, a difference of 0.25%), Japanese (8.3%, a difference of 0.27%), and Immigrants from Asia (8.3%, a difference of 0.29%).
| Demographics | Rating | Rank | Unemployment Among Seniors over 75 years |
| French American Indians | 98.7 /100 | #111 | Exceptional 8.2% |
| Immigrants | India | 98.6 /100 | #112 | Exceptional 8.2% |
| Asians | 98.5 /100 | #113 | Exceptional 8.3% |
| Trinidadians and Tobagonians | 98.4 /100 | #114 | Exceptional 8.3% |
| Sudanese | 98.2 /100 | #115 | Exceptional 8.3% |
| Immigrants | West Indies | 98.1 /100 | #116 | Exceptional 8.3% |
| Immigrants | Greece | 97.9 /100 | #117 | Exceptional 8.3% |
| Immigrants | Middle Africa | 97.9 /100 | #118 | Exceptional 8.3% |
| Japanese | 97.5 /100 | #119 | Exceptional 8.3% |
| Immigrants | Asia | 97.4 /100 | #120 | Exceptional 8.3% |
| Immigrants | Croatia | 97.2 /100 | #121 | Exceptional 8.3% |
| Immigrants | Russia | 97.1 /100 | #122 | Exceptional 8.3% |
| Immigrants | Nepal | 96.9 /100 | #123 | Exceptional 8.3% |
| Thais | 96.8 /100 | #124 | Exceptional 8.3% |
| Immigrants | Moldova | 96.7 /100 | #125 | Exceptional 8.3% |
Demographics Similar to Jamaicans by Unemployment Among Seniors over 75 years
In terms of unemployment among seniors over 75 years, the demographic groups most similar to Jamaicans are Czechoslovakian (9.4%, a difference of 0.12%), Senegalese (9.5%, a difference of 0.20%), Immigrants from Iraq (9.4%, a difference of 0.26%), Bulgarian (9.4%, a difference of 0.29%), and Arab (9.5%, a difference of 0.29%).
| Demographics | Rating | Rank | Unemployment Among Seniors over 75 years |
| Immigrants | Mexico | 0.4 /100 | #267 | Tragic 9.4% |
| Greeks | 0.4 /100 | #268 | Tragic 9.4% |
| Puerto Ricans | 0.3 /100 | #269 | Tragic 9.4% |
| Yaqui | 0.3 /100 | #270 | Tragic 9.4% |
| Bulgarians | 0.3 /100 | #271 | Tragic 9.4% |
| Immigrants | Iraq | 0.3 /100 | #272 | Tragic 9.4% |
| Czechoslovakians | 0.3 /100 | #273 | Tragic 9.4% |
| Jamaicans | 0.2 /100 | #274 | Tragic 9.5% |
| Senegalese | 0.2 /100 | #275 | Tragic 9.5% |
| Arabs | 0.2 /100 | #276 | Tragic 9.5% |
| Swiss | 0.1 /100 | #277 | Tragic 9.5% |
| Immigrants | Senegal | 0.1 /100 | #278 | Tragic 9.6% |
| British | 0.1 /100 | #279 | Tragic 9.6% |
| Croatians | 0.1 /100 | #280 | Tragic 9.6% |
| Bangladeshis | 0.1 /100 | #281 | Tragic 9.6% |