Immigrants from Micronesia vs Czechoslovakian Professional Degree
COMPARE
Immigrants from Micronesia
Czechoslovakian
Professional Degree
Professional Degree Comparison
Immigrants from Micronesia
Czechoslovakians
3.2%
PROFESSIONAL DEGREE
0.1/ 100
METRIC RATING
318th/ 347
METRIC RANK
4.2%
PROFESSIONAL DEGREE
22.4/ 100
METRIC RATING
197th/ 347
METRIC RANK
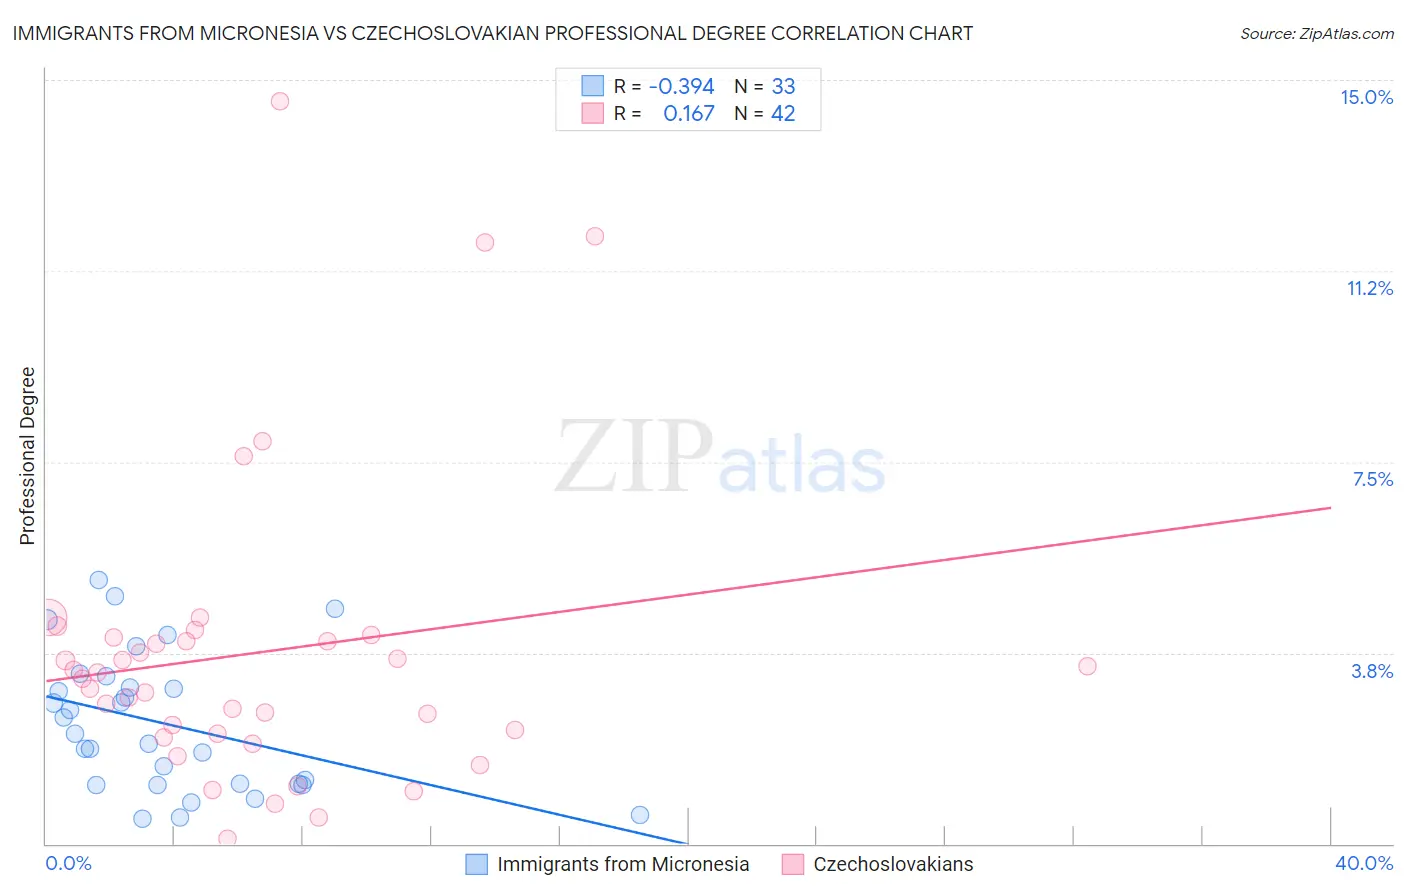
Immigrants from Micronesia vs Czechoslovakian Professional Degree Correlation Chart
The statistical analysis conducted on geographies consisting of 61,532,393 people shows a mild negative correlation between the proportion of Immigrants from Micronesia and percentage of population with at least professional degree education in the United States with a correlation coefficient (R) of -0.394 and weighted average of 3.2%. Similarly, the statistical analysis conducted on geographies consisting of 367,571,969 people shows a poor positive correlation between the proportion of Czechoslovakians and percentage of population with at least professional degree education in the United States with a correlation coefficient (R) of 0.167 and weighted average of 4.2%, a difference of 30.0%.
Professional Degree Correlation Summary
| Measurement | Immigrants from Micronesia | Czechoslovakian |
| Minimum | 0.49% | 0.10% |
| Maximum | 5.2% | 14.6% |
| Range | 4.7% | 14.5% |
| Mean | 2.4% | 3.7% |
| Median | 2.2% | 3.3% |
| Interquartile 25% (IQ1) | 1.2% | 2.2% |
| Interquartile 75% (IQ3) | 3.2% | 4.0% |
| Interquartile Range (IQR) | 2.0% | 1.9% |
| Standard Deviation (Sample) | 1.3% | 3.0% |
| Standard Deviation (Population) | 1.3% | 3.0% |
Similar Demographics by Professional Degree
Demographics Similar to Immigrants from Micronesia by Professional Degree
In terms of professional degree, the demographic groups most similar to Immigrants from Micronesia are Nepalese (3.2%, a difference of 0.030%), Puerto Rican (3.2%, a difference of 0.24%), Choctaw (3.2%, a difference of 0.24%), Immigrants from Laos (3.2%, a difference of 0.25%), and Mexican American Indian (3.3%, a difference of 0.93%).
| Demographics | Rating | Rank | Professional Degree |
| Cherokee | 0.1 /100 | #311 | Tragic 3.3% |
| Sioux | 0.1 /100 | #312 | Tragic 3.3% |
| Yuman | 0.1 /100 | #313 | Tragic 3.3% |
| Mexican American Indians | 0.1 /100 | #314 | Tragic 3.3% |
| Immigrants | Laos | 0.1 /100 | #315 | Tragic 3.2% |
| Puerto Ricans | 0.1 /100 | #316 | Tragic 3.2% |
| Nepalese | 0.1 /100 | #317 | Tragic 3.2% |
| Immigrants | Micronesia | 0.1 /100 | #318 | Tragic 3.2% |
| Choctaw | 0.1 /100 | #319 | Tragic 3.2% |
| Seminole | 0.1 /100 | #320 | Tragic 3.2% |
| Tsimshian | 0.0 /100 | #321 | Tragic 3.2% |
| Hispanics or Latinos | 0.0 /100 | #322 | Tragic 3.2% |
| Inupiat | 0.0 /100 | #323 | Tragic 3.2% |
| Crow | 0.0 /100 | #324 | Tragic 3.2% |
| Yaqui | 0.0 /100 | #325 | Tragic 3.2% |
Demographics Similar to Czechoslovakians by Professional Degree
In terms of professional degree, the demographic groups most similar to Czechoslovakians are Immigrants from Middle Africa (4.2%, a difference of 0.050%), Spanish (4.2%, a difference of 0.14%), Norwegian (4.2%, a difference of 0.42%), Nigerian (4.2%, a difference of 0.47%), and Immigrants from North Macedonia (4.2%, a difference of 0.50%).
| Demographics | Rating | Rank | Professional Degree |
| Immigrants | Poland | 29.2 /100 | #190 | Fair 4.3% |
| Sri Lankans | 29.0 /100 | #191 | Fair 4.3% |
| Ghanaians | 27.3 /100 | #192 | Fair 4.3% |
| French | 27.1 /100 | #193 | Fair 4.2% |
| Scandinavians | 25.8 /100 | #194 | Fair 4.2% |
| Nigerians | 24.6 /100 | #195 | Fair 4.2% |
| Spanish | 23.0 /100 | #196 | Fair 4.2% |
| Czechoslovakians | 22.4 /100 | #197 | Fair 4.2% |
| Immigrants | Middle Africa | 22.1 /100 | #198 | Fair 4.2% |
| Norwegians | 20.5 /100 | #199 | Fair 4.2% |
| Immigrants | North Macedonia | 20.2 /100 | #200 | Fair 4.2% |
| Finns | 18.7 /100 | #201 | Poor 4.2% |
| Immigrants | Iraq | 17.1 /100 | #202 | Poor 4.2% |
| Panamanians | 15.9 /100 | #203 | Poor 4.1% |
| Barbadians | 15.8 /100 | #204 | Poor 4.1% |