Immigrants from Mexico vs Indian (Asian) High School Diploma

COMPARE

Immigrants from Mexico
Race
Ancestry
AfghanAfricanAlaska NativeAlaskan AthabascanAlbanianAleutAlsatianAmericanApacheArabArapahoArgentineanArmenianAssyrian/Chaldean/SyriacAustralianAustrianBahamianBangladeshiBarbadianBasqueBelgianBelizeanBermudanBhutaneseBlackfeetBolivianBrazilianBritishBritish West IndianBulgarianBurmeseCajunCambodianCanadianCape VerdeanCarpatho RusynCelticCentral AmericanCentral American IndianCherokeeCheyenneChickasawChileanChineseChippewaChoctawColombianColvilleComancheCosta RicanCreeCreekCroatianCrowCubanCypriotCzechCzechoslovakianDanishDelawareDominicanDutchDutch West IndianEastern EuropeanEcuadorianEgyptianEnglishEstonianEthiopianEuropeanFijianFilipinoFinnishFrenchFrench American IndianFrench CanadianGermanGerman RussianGhanaianGreekGuamanian/ChamorroGuatemalanGuyaneseHaitianHmongHonduranHopiHoumaHungarianIcelanderIndonesianInupiatIranianIraqiIrishIroquoisIsraeliItalianJamaicanJapaneseJordanianKenyanKiowaKoreanLaotianLatvianLebaneseLiberianLithuanianLumbeeLuxembourgerMacedonianMalaysianMalteseMarshalleseMenomineeMexicanMexican American IndianMongolianMoroccanNative HawaiianNavajoNepaleseNew ZealanderNicaraguanNigerianNorthern EuropeanNorwegianOkinawanOsageOttawaPaiutePakistaniPalestinianPanamanianParaguayanPennsylvania GermanPeruvianPimaPolishPortuguesePotawatomiPuebloPuerto RicanPuget Sound SalishRomanianRussianSalvadoranSamoanScandinavianScotch-IrishScottishSeminoleSenegaleseSerbianShoshoneSierra LeoneanSiouxSlavicSlovakSloveneSomaliSouth AfricanSouth AmericanSouth American IndianSoviet UnionSpaniardSpanishSpanish AmericanSpanish American IndianSri LankanSubsaharan AfricanSudaneseSwedishSwissSyrianTaiwaneseThaiTlingit-HaidaTohono O'OdhamTonganTrinidadian and TobagonianTsimshianTurkishU.S. Virgin IslanderUgandanUkrainianUruguayanUteVenezuelanVietnameseWelshWest IndianYakamaYaquiYugoslavianYumanYup'ikZimbabwean
Immigration
NonimmigrantsImmigrantsAfghanistanAfricaAlbaniaArgentinaArmeniaAsiaAustraliaAustriaBahamasBangladeshBarbadosBelarusBelgiumBelizeBoliviaBosnia and HerzegovinaBrazilBulgariaBurma/MyanmarCabo VerdeCambodiaCameroonCanadaCaribbeanCentral AmericaChileChinaColombiaCongoCosta RicaCroatiaCubaCzechoslovakiaDenmarkDominicaDominican RepublicEastern AfricaEastern AsiaEastern EuropeEcuadorEgyptEl SalvadorEnglandEritreaEthiopiaEuropeFijiFranceGermanyGhanaGreeceGrenadaGuatemalaGuyanaHaitiHondurasHong KongHungaryIndiaIndonesiaIranIraqIrelandIsraelItalyJamaicaJapanJordanKazakhstanKenyaKoreaKuwaitLaosLatin AmericaLatviaLebanonLiberiaLithuaniaMalaysiaMexicoMicronesiaMiddle AfricaMoldovaMoroccoNepalNetherlandsNicaraguaNigeriaNorth AmericaNorth MacedoniaNorthern AfricaNorthern EuropeNorwayOceaniaPakistanPanamaPeruPhilippinesPolandPortugalRomaniaRussiaSaudi ArabiaScotlandSenegalSerbiaSierra LeoneSingaporeSomaliaSouth AfricaSouth AmericaSouth Central AsiaSouth Eastern AsiaSouthern EuropeSpainSri LankaSt. Vincent and the GrenadinesSudanSwedenSwitzerlandSyriaTaiwanThailandTrinidad and TobagoTurkeyUgandaUkraineUruguayUzbekistanVenezuelaVietnamWest IndiesWestern AfricaWestern AsiaWestern EuropeYemenZaireZimbabweAzores
Indian (Asian)
Race
Ancestry
AfghanAfricanAlaska NativeAlaskan AthabascanAlbanianAleutAlsatianAmericanApacheArabArapahoArgentineanArmenianAssyrian/Chaldean/SyriacAustralianAustrianBahamianBangladeshiBarbadianBasqueBelgianBelizeanBermudanBhutaneseBlackfeetBolivianBrazilianBritishBritish West IndianBulgarianBurmeseCajunCambodianCanadianCape VerdeanCarpatho RusynCelticCentral AmericanCentral American IndianCherokeeCheyenneChickasawChileanChineseChippewaChoctawColombianColvilleComancheCosta RicanCreeCreekCroatianCrowCubanCypriotCzechCzechoslovakianDanishDelawareDominicanDutchDutch West IndianEastern EuropeanEcuadorianEgyptianEnglishEstonianEthiopianEuropeanFijianFilipinoFinnishFrenchFrench American IndianFrench CanadianGermanGerman RussianGhanaianGreekGuamanian/ChamorroGuatemalanGuyaneseHaitianHmongHonduranHopiHoumaHungarianIcelanderIndian (Asian)IndonesianInupiatIranianIraqiIrishIroquoisIsraeliItalianJamaicanJapaneseJordanianKenyanKiowaKoreanLaotianLatvianLebaneseLiberianLithuanianLumbeeLuxembourgerMacedonianMalaysianMalteseMarshalleseMenomineeMexicanMexican American IndianMongolianMoroccanNative HawaiianNavajoNepaleseNew ZealanderNicaraguanNigerianNorthern EuropeanNorwegianOkinawanOsageOttawaPaiutePakistaniPalestinianPanamanianParaguayanPennsylvania GermanPeruvianPimaPolishPortuguesePotawatomiPuebloPuerto RicanPuget Sound SalishRomanianRussianSalvadoranSamoanScandinavianScotch-IrishScottishSeminoleSenegaleseSerbianShoshoneSierra LeoneanSiouxSlavicSlovakSloveneSomaliSouth AfricanSouth AmericanSouth American IndianSoviet UnionSpaniardSpanishSpanish AmericanSpanish American IndianSri LankanSubsaharan AfricanSudaneseSwedishSwissSyrianTaiwaneseThaiTlingit-HaidaTohono O'OdhamTonganTrinidadian and TobagonianTsimshianTurkishU.S. Virgin IslanderUgandanUkrainianUruguayanUteVenezuelanVietnameseWelshWest IndianYakamaYaquiYugoslavianYumanYup'ikZimbabwean
Immigration
NonimmigrantsImmigrantsAfghanistanAfricaAlbaniaArgentinaArmeniaAsiaAustraliaAustriaBahamasBangladeshBarbadosBelarusBelgiumBelizeBoliviaBosnia and HerzegovinaBrazilBulgariaBurma/MyanmarCabo VerdeCambodiaCameroonCanadaCaribbeanCentral AmericaChileChinaColombiaCongoCosta RicaCroatiaCubaCzechoslovakiaDenmarkDominicaDominican RepublicEastern AfricaEastern AsiaEastern EuropeEcuadorEgyptEl SalvadorEnglandEritreaEthiopiaEuropeFijiFranceGermanyGhanaGreeceGrenadaGuatemalaGuyanaHaitiHondurasHong KongHungaryIndiaIndonesiaIranIraqIrelandIsraelItalyJamaicaJapanJordanKazakhstanKenyaKoreaKuwaitLaosLatin AmericaLatviaLebanonLiberiaLithuaniaMalaysiaMicronesiaMiddle AfricaMoldovaMoroccoNepalNetherlandsNicaraguaNigeriaNorth AmericaNorth MacedoniaNorthern AfricaNorthern EuropeNorwayOceaniaPakistanPanamaPeruPhilippinesPolandPortugalRomaniaRussiaSaudi ArabiaScotlandSenegalSerbiaSierra LeoneSingaporeSomaliaSouth AfricaSouth AmericaSouth Central AsiaSouth Eastern AsiaSouthern EuropeSpainSri LankaSt. Vincent and the GrenadinesSudanSwedenSwitzerlandSyriaTaiwanThailandTrinidad and TobagoTurkeyUgandaUkraineUruguayUzbekistanVenezuelaVietnamWest IndiesWestern AfricaWestern AsiaWestern EuropeYemenZaireZimbabweAzores
High School Diploma
Income
Poverty
Unemployment
Labor Participation
Family Structure
Vehicle Availability
Education Level
Disability

High School Diploma Comparison

Immigrants from Mexico

Indians (Asian)

Tragic
Good
79.5%
HIGH SCHOOL DIPLOMA
0.0/ 100
METRIC RATING
347th/ 347
METRIC RANK
89.6%
HIGH SCHOOL DIPLOMA
78.8/ 100
METRIC RATING
142nd/ 347
METRIC RANK

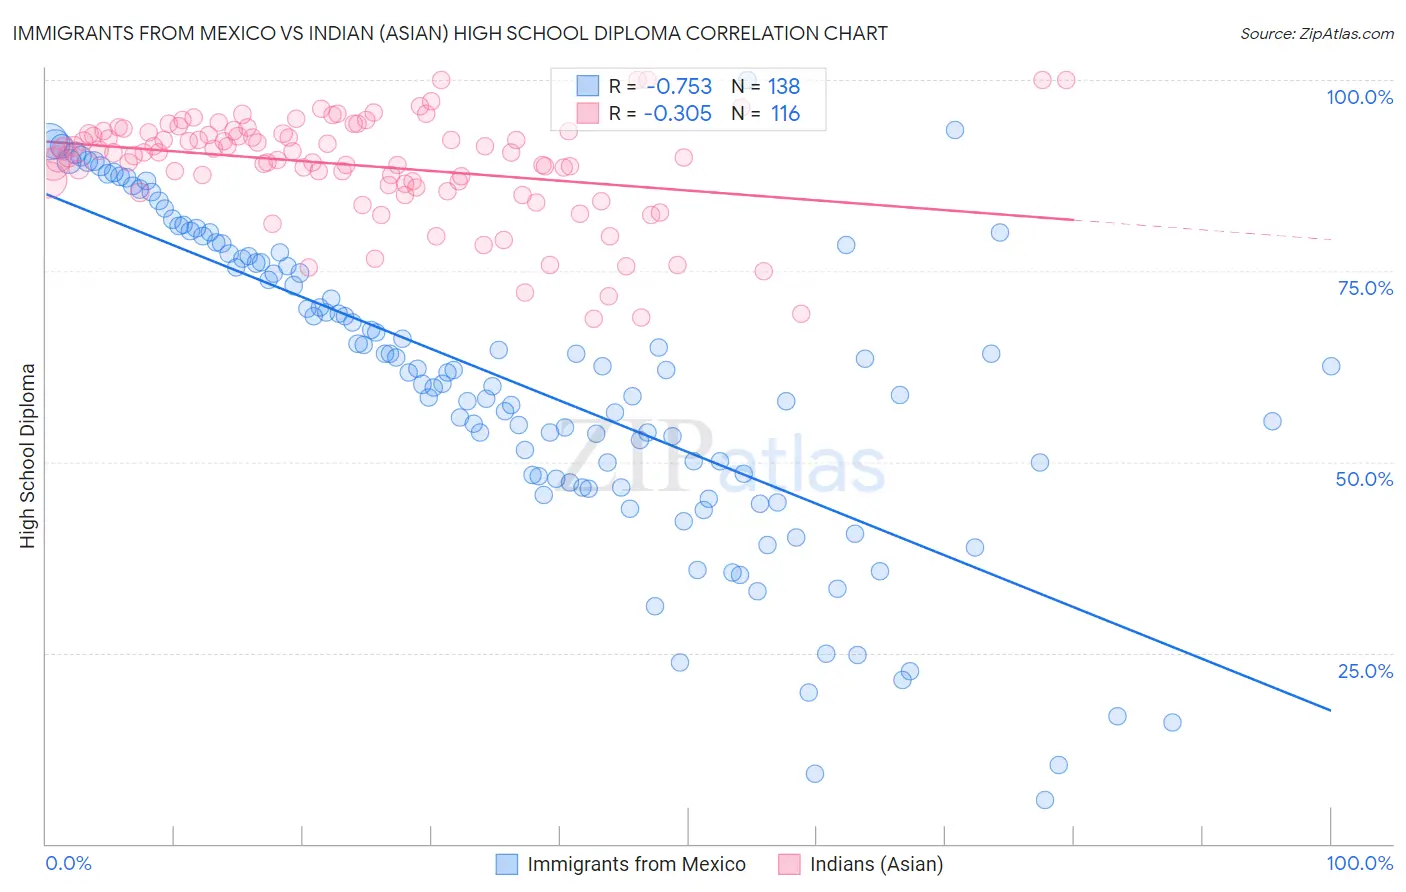
Immigrants from Mexico vs Indian (Asian) High School Diploma Correlation Chart

The statistical analysis conducted on geographies consisting of 513,765,698 people shows a strong negative correlation between the proportion of Immigrants from Mexico and percentage of population with at least high school diploma education in the United States with a correlation coefficient (R) of -0.753 and weighted average of 79.5%. Similarly, the statistical analysis conducted on geographies consisting of 495,347,994 people shows a mild negative correlation between the proportion of Indians (Asian) and percentage of population with at least high school diploma education in the United States with a correlation coefficient (R) of -0.305 and weighted average of 89.6%, a difference of 12.6%.
Immigrants from Mexico vs Indian (Asian) High School Diploma

High School Diploma Correlation Summary

MeasurementImmigrants from MexicoIndian (Asian)
Minimum5.7%68.7%
Maximum100.0%100.0%
Range94.3%31.3%
Mean60.7%88.8%
Median62.1%90.4%
Interquartile 25% (IQ1)48.1%86.3%
Interquartile 75% (IQ3)77.0%93.2%
Interquartile Range (IQR)28.9%6.9%
Standard Deviation (Sample)20.3%6.8%
Standard Deviation (Population)20.2%6.8%

Similar Demographics by High School Diploma

Demographics Similar to Immigrants from Mexico by High School Diploma

In terms of high school diploma, the demographic groups most similar to Immigrants from Mexico are Spanish American Indian (79.8%, a difference of 0.27%), Yakama (80.0%, a difference of 0.56%), Immigrants from Central America (80.1%, a difference of 0.72%), Immigrants from El Salvador (80.8%, a difference of 1.6%), and Immigrants from Guatemala (81.4%, a difference of 2.3%).
DemographicsRating | RankHigh School Diploma
Immigrants | Latin America
0.0
/100
|
#333
Tragic
82.1%
Tohono O'odham
0.0
/100
|
#334
Tragic
82.1%
Guatemalans
0.0
/100
|
#335
Tragic
82.0%
Immigrants | Dominican Republic
0.0
/100
|
#336
Tragic
82.0%
Immigrants | Yemen
0.0
/100
|
#337
Tragic
81.8%
Salvadorans
0.0
/100
|
#338
Tragic
81.7%
Pima
0.0
/100
|
#339
Tragic
81.6%
Houma
0.0
/100
|
#340
Tragic
81.5%
Mexicans
0.0
/100
|
#341
Tragic
81.4%
Immigrants | Guatemala
0.0
/100
|
#342
Tragic
81.4%
Immigrants | El Salvador
0.0
/100
|
#343
Tragic
80.8%
Immigrants | Central America
0.0
/100
|
#344
Tragic
80.1%
Yakama
0.0
/100
|
#345
Tragic
80.0%
Spanish American Indians
0.0
/100
|
#346
Tragic
79.8%
Immigrants | Mexico
0.0
/100
|
#347
Tragic
79.5%

Demographics Similar to Indians (Asian) by High School Diploma

In terms of high school diploma, the demographic groups most similar to Indians (Asian) are Chilean (89.6%, a difference of 0.0%), Pakistani (89.6%, a difference of 0.010%), Immigrants from Kenya (89.6%, a difference of 0.020%), Immigrants from Brazil (89.5%, a difference of 0.050%), and Kenyan (89.6%, a difference of 0.060%).
DemographicsRating | RankHigh School Diploma
Chippewa
85.6
/100
|
#135
Excellent
89.7%
Ugandans
83.7
/100
|
#136
Excellent
89.7%
Arabs
83.6
/100
|
#137
Excellent
89.7%
Assyrians/Chaldeans/Syriacs
82.5
/100
|
#138
Excellent
89.7%
Kenyans
81.4
/100
|
#139
Excellent
89.6%
Immigrants | Egypt
81.2
/100
|
#140
Excellent
89.6%
Chileans
79.0
/100
|
#141
Good
89.6%
Indians (Asian)
78.8
/100
|
#142
Good
89.6%
Pakistanis
78.3
/100
|
#143
Good
89.6%
Immigrants | Kenya
78.0
/100
|
#144
Good
89.6%
Immigrants | Brazil
76.6
/100
|
#145
Good
89.5%
Immigrants | Spain
76.2
/100
|
#146
Good
89.5%
Iraqis
73.9
/100
|
#147
Good
89.5%
Immigrants | Lebanon
73.4
/100
|
#148
Good
89.5%
Immigrants | Poland
72.9
/100
|
#149
Good
89.5%