Immigrants from Mexico vs Indian (Asian) 8th Grade
COMPARE
Immigrants from Mexico
Indian (Asian)
8th Grade
8th Grade Comparison
Immigrants from Mexico
Indians (Asian)
90.2%
8TH GRADE
0.0/ 100
METRIC RATING
346th/ 347
METRIC RANK
95.2%
8TH GRADE
3.3/ 100
METRIC RATING
232nd/ 347
METRIC RANK
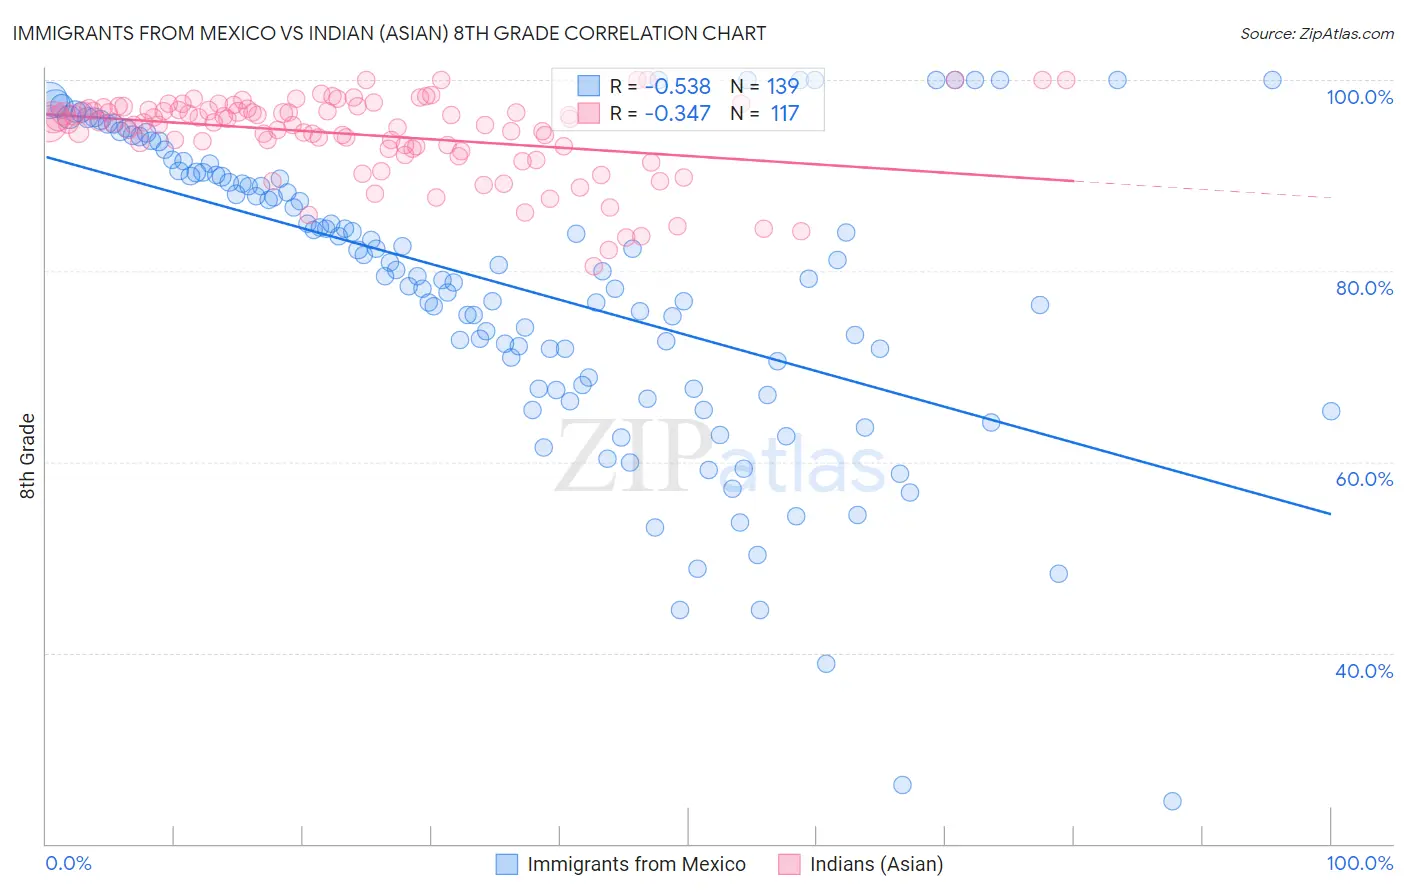
Immigrants from Mexico vs Indian (Asian) 8th Grade Correlation Chart
The statistical analysis conducted on geographies consisting of 513,767,012 people shows a substantial negative correlation between the proportion of Immigrants from Mexico and percentage of population with at least 8th grade education in the United States with a correlation coefficient (R) of -0.538 and weighted average of 90.2%. Similarly, the statistical analysis conducted on geographies consisting of 495,348,182 people shows a mild negative correlation between the proportion of Indians (Asian) and percentage of population with at least 8th grade education in the United States with a correlation coefficient (R) of -0.347 and weighted average of 95.2%, a difference of 5.6%.
8th Grade Correlation Summary
| Measurement | Immigrants from Mexico | Indian (Asian) |
| Minimum | 24.5% | 80.4% |
| Maximum | 100.0% | 100.0% |
| Range | 75.5% | 19.6% |
| Mean | 78.4% | 94.3% |
| Median | 80.1% | 95.5% |
| Interquartile 25% (IQ1) | 68.0% | 92.8% |
| Interquartile 75% (IQ3) | 90.3% | 96.9% |
| Interquartile Range (IQR) | 22.3% | 4.1% |
| Standard Deviation (Sample) | 15.7% | 4.2% |
| Standard Deviation (Population) | 15.6% | 4.2% |
Similar Demographics by 8th Grade
Demographics Similar to Immigrants from Mexico by 8th Grade
In terms of 8th grade, the demographic groups most similar to Immigrants from Mexico are Immigrants from El Salvador (90.3%, a difference of 0.18%), Immigrants from Central America (90.4%, a difference of 0.27%), Spanish American Indian (89.8%, a difference of 0.44%), Immigrants from Guatemala (90.7%, a difference of 0.64%), and Salvadoran (90.9%, a difference of 0.81%).
| Demographics | Rating | Rank | 8th Grade |
| Hispanics or Latinos | 0.0 /100 | #333 | Tragic 92.2% |
| Immigrants | Yemen | 0.0 /100 | #334 | Tragic 92.1% |
| Mexican American Indians | 0.0 /100 | #335 | Tragic 92.1% |
| Immigrants | Honduras | 0.0 /100 | #336 | Tragic 91.9% |
| Immigrants | Latin America | 0.0 /100 | #337 | Tragic 91.7% |
| Central Americans | 0.0 /100 | #338 | Tragic 91.6% |
| Mexicans | 0.0 /100 | #339 | Tragic 91.4% |
| Yakama | 0.0 /100 | #340 | Tragic 91.2% |
| Guatemalans | 0.0 /100 | #341 | Tragic 91.1% |
| Salvadorans | 0.0 /100 | #342 | Tragic 90.9% |
| Immigrants | Guatemala | 0.0 /100 | #343 | Tragic 90.7% |
| Immigrants | Central America | 0.0 /100 | #344 | Tragic 90.4% |
| Immigrants | El Salvador | 0.0 /100 | #345 | Tragic 90.3% |
| Immigrants | Mexico | 0.0 /100 | #346 | Tragic 90.2% |
| Spanish American Indians | 0.0 /100 | #347 | Tragic 89.8% |
Demographics Similar to Indians (Asian) by 8th Grade
In terms of 8th grade, the demographic groups most similar to Indians (Asian) are Asian (95.2%, a difference of 0.010%), Immigrants from Asia (95.2%, a difference of 0.010%), Costa Rican (95.2%, a difference of 0.020%), Nigerian (95.2%, a difference of 0.020%), and Immigrants from Panama (95.2%, a difference of 0.030%).
| Demographics | Rating | Rank | 8th Grade |
| Sub-Saharan Africans | 6.0 /100 | #225 | Tragic 95.3% |
| Navajo | 5.7 /100 | #226 | Tragic 95.3% |
| Bahamians | 5.6 /100 | #227 | Tragic 95.3% |
| Immigrants | Eastern Africa | 5.6 /100 | #228 | Tragic 95.3% |
| Immigrants | Indonesia | 4.4 /100 | #229 | Tragic 95.3% |
| Immigrants | Panama | 4.1 /100 | #230 | Tragic 95.2% |
| Asians | 3.5 /100 | #231 | Tragic 95.2% |
| Indians (Asian) | 3.3 /100 | #232 | Tragic 95.2% |
| Immigrants | Asia | 3.1 /100 | #233 | Tragic 95.2% |
| Costa Ricans | 3.0 /100 | #234 | Tragic 95.2% |
| Nigerians | 2.9 /100 | #235 | Tragic 95.2% |
| Senegalese | 2.7 /100 | #236 | Tragic 95.2% |
| Immigrants | Africa | 2.7 /100 | #237 | Tragic 95.2% |
| Natives/Alaskans | 2.3 /100 | #238 | Tragic 95.2% |
| Immigrants | Sierra Leone | 2.1 /100 | #239 | Tragic 95.1% |