Immigrants from Mexico vs Argentinean 8th Grade
COMPARE
Immigrants from Mexico
Argentinean
8th Grade
8th Grade Comparison
Immigrants from Mexico
Argentineans
90.2%
8TH GRADE
0.0/ 100
METRIC RATING
346th/ 347
METRIC RANK
95.5%
8TH GRADE
22.2/ 100
METRIC RATING
200th/ 347
METRIC RANK
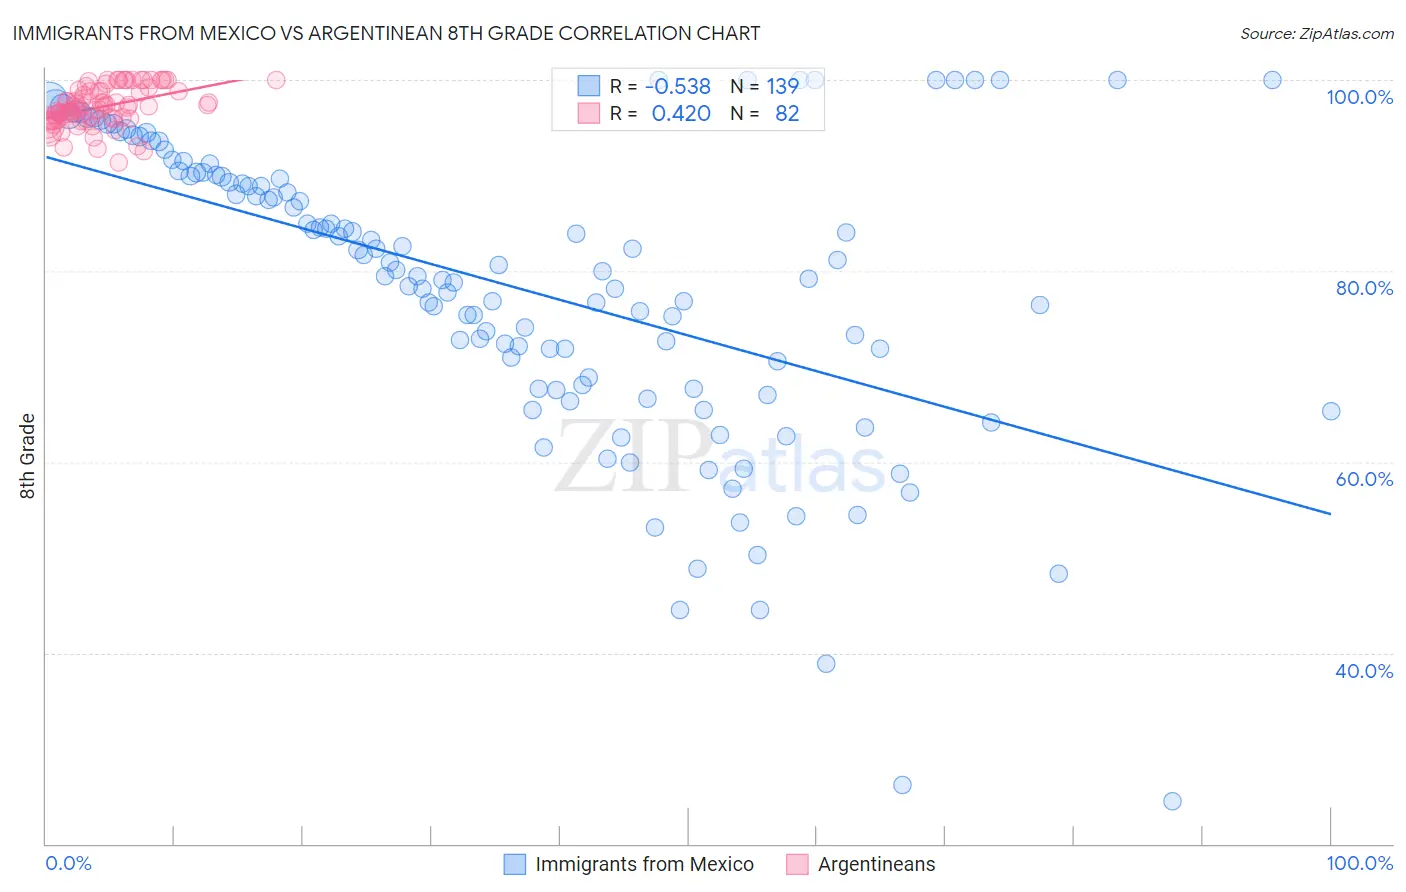
Immigrants from Mexico vs Argentinean 8th Grade Correlation Chart
The statistical analysis conducted on geographies consisting of 513,767,012 people shows a substantial negative correlation between the proportion of Immigrants from Mexico and percentage of population with at least 8th grade education in the United States with a correlation coefficient (R) of -0.538 and weighted average of 90.2%. Similarly, the statistical analysis conducted on geographies consisting of 297,143,432 people shows a moderate positive correlation between the proportion of Argentineans and percentage of population with at least 8th grade education in the United States with a correlation coefficient (R) of 0.420 and weighted average of 95.5%, a difference of 6.0%.
8th Grade Correlation Summary
| Measurement | Immigrants from Mexico | Argentinean |
| Minimum | 24.5% | 91.4% |
| Maximum | 100.0% | 100.0% |
| Range | 75.5% | 8.6% |
| Mean | 78.4% | 97.2% |
| Median | 80.1% | 97.2% |
| Interquartile 25% (IQ1) | 68.0% | 95.9% |
| Interquartile 75% (IQ3) | 90.3% | 98.8% |
| Interquartile Range (IQR) | 22.3% | 2.9% |
| Standard Deviation (Sample) | 15.7% | 2.1% |
| Standard Deviation (Population) | 15.6% | 2.1% |
Similar Demographics by 8th Grade
Demographics Similar to Immigrants from Mexico by 8th Grade
In terms of 8th grade, the demographic groups most similar to Immigrants from Mexico are Immigrants from El Salvador (90.3%, a difference of 0.18%), Immigrants from Central America (90.4%, a difference of 0.27%), Spanish American Indian (89.8%, a difference of 0.44%), Immigrants from Guatemala (90.7%, a difference of 0.64%), and Salvadoran (90.9%, a difference of 0.81%).
| Demographics | Rating | Rank | 8th Grade |
| Hispanics or Latinos | 0.0 /100 | #333 | Tragic 92.2% |
| Immigrants | Yemen | 0.0 /100 | #334 | Tragic 92.1% |
| Mexican American Indians | 0.0 /100 | #335 | Tragic 92.1% |
| Immigrants | Honduras | 0.0 /100 | #336 | Tragic 91.9% |
| Immigrants | Latin America | 0.0 /100 | #337 | Tragic 91.7% |
| Central Americans | 0.0 /100 | #338 | Tragic 91.6% |
| Mexicans | 0.0 /100 | #339 | Tragic 91.4% |
| Yakama | 0.0 /100 | #340 | Tragic 91.2% |
| Guatemalans | 0.0 /100 | #341 | Tragic 91.1% |
| Salvadorans | 0.0 /100 | #342 | Tragic 90.9% |
| Immigrants | Guatemala | 0.0 /100 | #343 | Tragic 90.7% |
| Immigrants | Central America | 0.0 /100 | #344 | Tragic 90.4% |
| Immigrants | El Salvador | 0.0 /100 | #345 | Tragic 90.3% |
| Immigrants | Mexico | 0.0 /100 | #346 | Tragic 90.2% |
| Spanish American Indians | 0.0 /100 | #347 | Tragic 89.8% |
Demographics Similar to Argentineans by 8th Grade
In terms of 8th grade, the demographic groups most similar to Argentineans are Paraguayan (95.5%, a difference of 0.0%), Immigrants from Northern Africa (95.5%, a difference of 0.0%), Assyrian/Chaldean/Syriac (95.6%, a difference of 0.020%), Sierra Leonean (95.6%, a difference of 0.020%), and Immigrants from Argentina (95.5%, a difference of 0.020%).
| Demographics | Rating | Rank | 8th Grade |
| Panamanians | 28.4 /100 | #193 | Fair 95.6% |
| Guamanians/Chamorros | 26.6 /100 | #194 | Fair 95.6% |
| Immigrants | Zaire | 25.2 /100 | #195 | Fair 95.6% |
| Assyrians/Chaldeans/Syriacs | 24.5 /100 | #196 | Fair 95.6% |
| Sierra Leoneans | 24.3 /100 | #197 | Fair 95.6% |
| Paraguayans | 22.6 /100 | #198 | Fair 95.5% |
| Immigrants | Northern Africa | 22.5 /100 | #199 | Fair 95.5% |
| Argentineans | 22.2 /100 | #200 | Fair 95.5% |
| Immigrants | Argentina | 20.6 /100 | #201 | Fair 95.5% |
| Apache | 19.4 /100 | #202 | Poor 95.5% |
| Moroccans | 17.4 /100 | #203 | Poor 95.5% |
| Hawaiians | 16.7 /100 | #204 | Poor 95.5% |
| Immigrants | Bahamas | 16.7 /100 | #205 | Poor 95.5% |
| Comanche | 16.3 /100 | #206 | Poor 95.5% |
| Immigrants | Sudan | 15.1 /100 | #207 | Poor 95.5% |