Immigrants from Mexico vs Apache Doctorate Degree
COMPARE
Immigrants from Mexico
Apache
Doctorate Degree
Doctorate Degree Comparison
Immigrants from Mexico
Apache
1.1%
DOCTORATE DEGREE
0.0/ 100
METRIC RATING
344th/ 347
METRIC RANK
1.5%
DOCTORATE DEGREE
1.3/ 100
METRIC RATING
251st/ 347
METRIC RANK
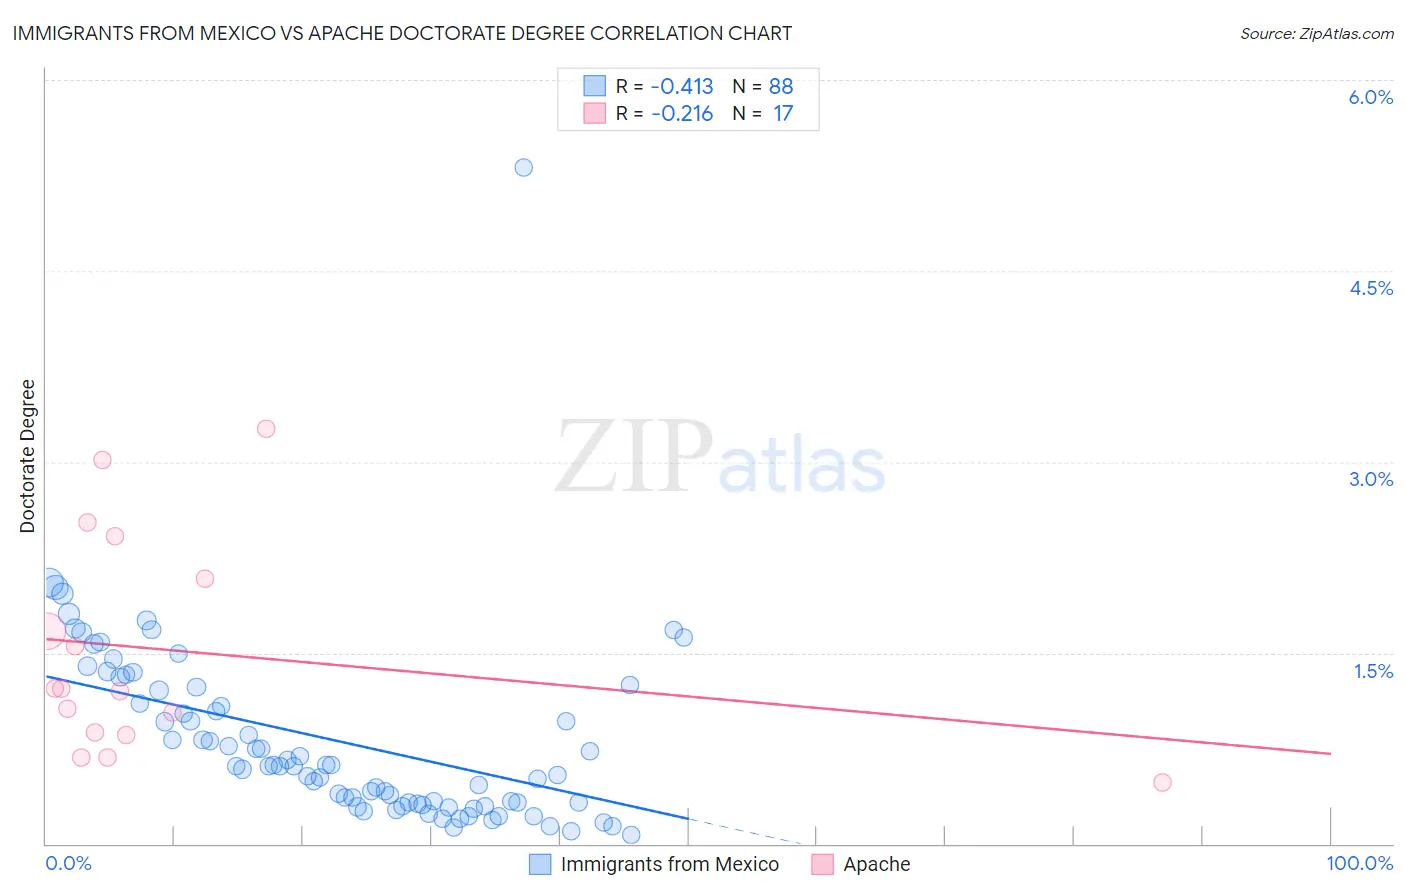
Immigrants from Mexico vs Apache Doctorate Degree Correlation Chart
The statistical analysis conducted on geographies consisting of 497,630,711 people shows a moderate negative correlation between the proportion of Immigrants from Mexico and percentage of population with at least doctorate degree education in the United States with a correlation coefficient (R) of -0.413 and weighted average of 1.1%. Similarly, the statistical analysis conducted on geographies consisting of 228,067,045 people shows a weak negative correlation between the proportion of Apache and percentage of population with at least doctorate degree education in the United States with a correlation coefficient (R) of -0.216 and weighted average of 1.5%, a difference of 40.0%.
Doctorate Degree Correlation Summary
| Measurement | Immigrants from Mexico | Apache |
| Minimum | 0.070% | 0.48% |
| Maximum | 5.3% | 3.3% |
| Range | 5.2% | 2.8% |
| Mean | 0.81% | 1.5% |
| Median | 0.61% | 1.2% |
| Interquartile 25% (IQ1) | 0.32% | 0.86% |
| Interquartile 75% (IQ3) | 1.2% | 2.3% |
| Interquartile Range (IQR) | 0.90% | 1.4% |
| Standard Deviation (Sample) | 0.72% | 0.85% |
| Standard Deviation (Population) | 0.72% | 0.82% |
Similar Demographics by Doctorate Degree
Demographics Similar to Immigrants from Mexico by Doctorate Degree
In terms of doctorate degree, the demographic groups most similar to Immigrants from Mexico are Lumbee (1.1%, a difference of 1.5%), Fijian (1.1%, a difference of 2.1%), Spanish American Indian (1.1%, a difference of 4.4%), Arapaho (1.2%, a difference of 5.6%), and Mexican (1.2%, a difference of 5.9%).
| Demographics | Rating | Rank | Doctorate Degree |
| Immigrants | Caribbean | 0.0 /100 | #333 | Tragic 1.3% |
| Immigrants | Dominican Republic | 0.0 /100 | #334 | Tragic 1.3% |
| Immigrants | Haiti | 0.0 /100 | #335 | Tragic 1.3% |
| Nepalese | 0.0 /100 | #336 | Tragic 1.3% |
| Bangladeshis | 0.0 /100 | #337 | Tragic 1.2% |
| Puget Sound Salish | 0.0 /100 | #338 | Tragic 1.2% |
| Immigrants | Central America | 0.0 /100 | #339 | Tragic 1.2% |
| Immigrants | Cuba | 0.0 /100 | #340 | Tragic 1.2% |
| Mexicans | 0.0 /100 | #341 | Tragic 1.2% |
| Arapaho | 0.0 /100 | #342 | Tragic 1.2% |
| Fijians | 0.0 /100 | #343 | Tragic 1.1% |
| Immigrants | Mexico | 0.0 /100 | #344 | Tragic 1.1% |
| Lumbee | 0.0 /100 | #345 | Tragic 1.1% |
| Spanish American Indians | 0.0 /100 | #346 | Tragic 1.1% |
| Houma | 0.0 /100 | #347 | Tragic 0.96% |
Demographics Similar to Apache by Doctorate Degree
In terms of doctorate degree, the demographic groups most similar to Apache are Immigrants from Fiji (1.6%, a difference of 0.87%), Potawatomi (1.6%, a difference of 0.90%), Yuman (1.5%, a difference of 0.92%), American (1.5%, a difference of 1.1%), and Immigrants from Cambodia (1.5%, a difference of 1.2%).
| Demographics | Rating | Rank | Doctorate Degree |
| French American Indians | 2.0 /100 | #244 | Tragic 1.6% |
| Delaware | 1.9 /100 | #245 | Tragic 1.6% |
| Hmong | 1.8 /100 | #246 | Tragic 1.6% |
| Comanche | 1.8 /100 | #247 | Tragic 1.6% |
| Africans | 1.8 /100 | #248 | Tragic 1.6% |
| Potawatomi | 1.6 /100 | #249 | Tragic 1.6% |
| Immigrants | Fiji | 1.6 /100 | #250 | Tragic 1.6% |
| Apache | 1.3 /100 | #251 | Tragic 1.5% |
| Yuman | 1.1 /100 | #252 | Tragic 1.5% |
| Americans | 1.0 /100 | #253 | Tragic 1.5% |
| Immigrants | Cambodia | 1.0 /100 | #254 | Tragic 1.5% |
| Trinidadians and Tobagonians | 1.0 /100 | #255 | Tragic 1.5% |
| Central American Indians | 1.0 /100 | #256 | Tragic 1.5% |
| Chippewa | 0.9 /100 | #257 | Tragic 1.5% |
| Immigrants | West Indies | 0.9 /100 | #258 | Tragic 1.5% |