Immigrants from Malaysia vs Laotian 5th Grade
COMPARE
Immigrants from Malaysia
Laotian
5th Grade
5th Grade Comparison
Immigrants from Malaysia
Laotians
97.0%
5TH GRADE
4.1/ 100
METRIC RATING
231st/ 347
METRIC RANK
97.1%
5TH GRADE
10.8/ 100
METRIC RATING
208th/ 347
METRIC RANK
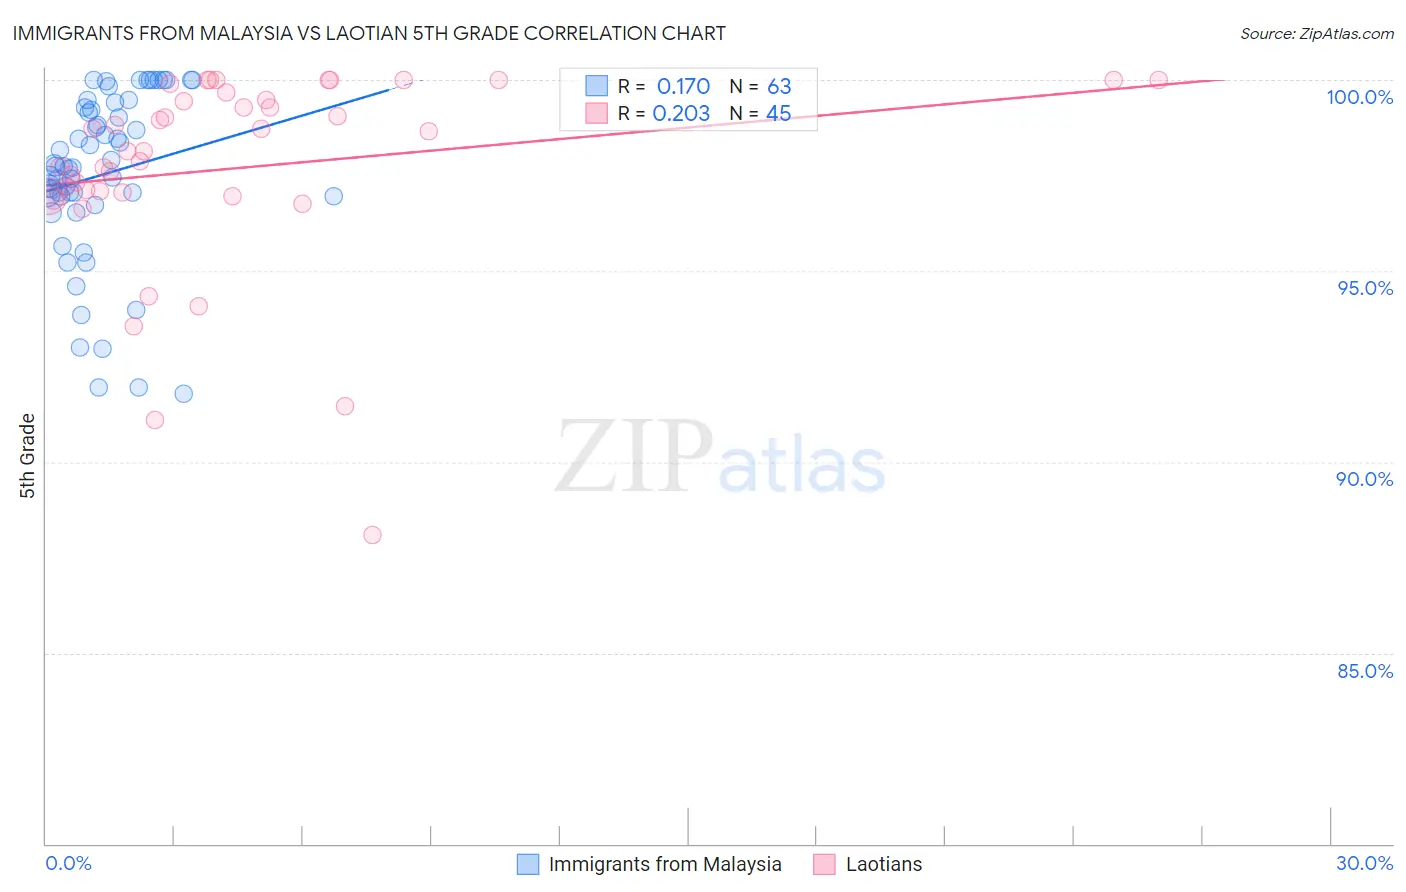
Immigrants from Malaysia vs Laotian 5th Grade Correlation Chart
The statistical analysis conducted on geographies consisting of 197,973,709 people shows a poor positive correlation between the proportion of Immigrants from Malaysia and percentage of population with at least 5th grade education in the United States with a correlation coefficient (R) of 0.170 and weighted average of 97.0%. Similarly, the statistical analysis conducted on geographies consisting of 224,856,886 people shows a weak positive correlation between the proportion of Laotians and percentage of population with at least 5th grade education in the United States with a correlation coefficient (R) of 0.203 and weighted average of 97.1%, a difference of 0.11%.
5th Grade Correlation Summary
| Measurement | Immigrants from Malaysia | Laotian |
| Minimum | 91.8% | 88.1% |
| Maximum | 100.0% | 100.0% |
| Range | 8.2% | 11.9% |
| Mean | 97.5% | 97.7% |
| Median | 97.7% | 98.1% |
| Interquartile 25% (IQ1) | 97.0% | 97.0% |
| Interquartile 75% (IQ3) | 99.3% | 99.6% |
| Interquartile Range (IQR) | 2.3% | 2.6% |
| Standard Deviation (Sample) | 2.2% | 2.6% |
| Standard Deviation (Population) | 2.2% | 2.6% |
Similar Demographics by 5th Grade
Demographics Similar to Immigrants from Malaysia by 5th Grade
In terms of 5th grade, the demographic groups most similar to Immigrants from Malaysia are Immigrants from Eastern Asia (97.0%, a difference of 0.0%), Immigrants from Pakistan (97.0%, a difference of 0.010%), Assyrian/Chaldean/Syriac (97.0%, a difference of 0.010%), Yuman (97.0%, a difference of 0.010%), and Immigrants from Western Asia (97.0%, a difference of 0.010%).
| Demographics | Rating | Rank | 5th Grade |
| South American Indians | 5.4 /100 | #224 | Tragic 97.0% |
| Bahamians | 5.3 /100 | #225 | Tragic 97.0% |
| Tongans | 5.3 /100 | #226 | Tragic 97.0% |
| Immigrants | Pakistan | 4.7 /100 | #227 | Tragic 97.0% |
| Assyrians/Chaldeans/Syriacs | 4.5 /100 | #228 | Tragic 97.0% |
| Yuman | 4.5 /100 | #229 | Tragic 97.0% |
| Immigrants | Western Asia | 4.3 /100 | #230 | Tragic 97.0% |
| Immigrants | Malaysia | 4.1 /100 | #231 | Tragic 97.0% |
| Immigrants | Eastern Asia | 4.0 /100 | #232 | Tragic 97.0% |
| Sub-Saharan Africans | 3.3 /100 | #233 | Tragic 97.0% |
| Tohono O'odham | 3.2 /100 | #234 | Tragic 97.0% |
| Uruguayans | 3.2 /100 | #235 | Tragic 97.0% |
| Senegalese | 2.8 /100 | #236 | Tragic 97.0% |
| Immigrants | Indonesia | 2.0 /100 | #237 | Tragic 96.9% |
| Asians | 2.0 /100 | #238 | Tragic 96.9% |
Demographics Similar to Laotians by 5th Grade
In terms of 5th grade, the demographic groups most similar to Laotians are Iraqi (97.1%, a difference of 0.0%), Moroccan (97.1%, a difference of 0.010%), Paiute (97.1%, a difference of 0.010%), Immigrants from Nepal (97.1%, a difference of 0.010%), and Immigrants from Oceania (97.1%, a difference of 0.010%).
| Demographics | Rating | Rank | 5th Grade |
| Immigrants | Chile | 16.6 /100 | #201 | Poor 97.2% |
| Africans | 15.3 /100 | #202 | Poor 97.2% |
| Immigrants | Bahamas | 14.9 /100 | #203 | Poor 97.2% |
| Immigrants | Zaire | 13.7 /100 | #204 | Poor 97.1% |
| Moroccans | 12.0 /100 | #205 | Poor 97.1% |
| Paiute | 11.6 /100 | #206 | Poor 97.1% |
| Iraqis | 10.9 /100 | #207 | Poor 97.1% |
| Laotians | 10.8 /100 | #208 | Poor 97.1% |
| Immigrants | Nepal | 10.3 /100 | #209 | Poor 97.1% |
| Immigrants | Oceania | 10.0 /100 | #210 | Poor 97.1% |
| Samoans | 8.5 /100 | #211 | Tragic 97.1% |
| Immigrants | Iraq | 8.3 /100 | #212 | Tragic 97.1% |
| Portuguese | 7.8 /100 | #213 | Tragic 97.1% |
| Costa Ricans | 7.7 /100 | #214 | Tragic 97.1% |
| Immigrants | Morocco | 7.5 /100 | #215 | Tragic 97.1% |