Immigrants from Malaysia vs Central American Kindergarten
COMPARE
Immigrants from Malaysia
Central American
Kindergarten
Kindergarten Comparison
Immigrants from Malaysia
Central Americans
97.7%
KINDERGARTEN
2.2/ 100
METRIC RATING
234th/ 347
METRIC RANK
96.6%
KINDERGARTEN
0.0/ 100
METRIC RATING
333rd/ 347
METRIC RANK
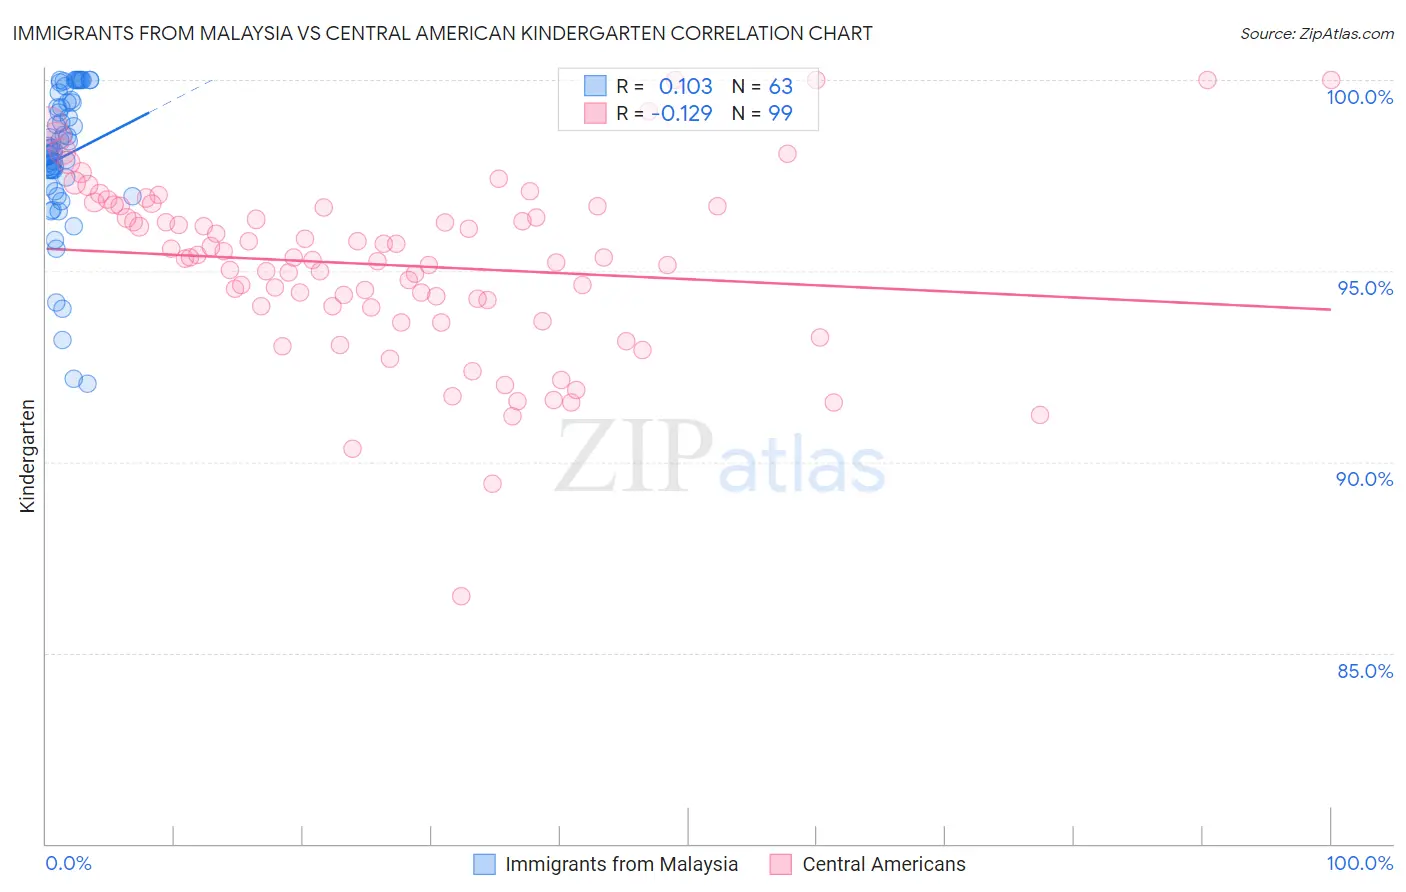
Immigrants from Malaysia vs Central American Kindergarten Correlation Chart
The statistical analysis conducted on geographies consisting of 197,973,709 people shows a poor positive correlation between the proportion of Immigrants from Malaysia and percentage of population with at least kindergarten education in the United States with a correlation coefficient (R) of 0.103 and weighted average of 97.7%. Similarly, the statistical analysis conducted on geographies consisting of 504,619,275 people shows a poor negative correlation between the proportion of Central Americans and percentage of population with at least kindergarten education in the United States with a correlation coefficient (R) of -0.129 and weighted average of 96.6%, a difference of 1.1%.
Kindergarten Correlation Summary
| Measurement | Immigrants from Malaysia | Central American |
| Minimum | 92.0% | 86.5% |
| Maximum | 100.0% | 100.0% |
| Range | 8.0% | 13.5% |
| Mean | 98.0% | 95.2% |
| Median | 98.2% | 95.3% |
| Interquartile 25% (IQ1) | 97.3% | 94.1% |
| Interquartile 75% (IQ3) | 99.4% | 96.7% |
| Interquartile Range (IQR) | 2.2% | 2.6% |
| Standard Deviation (Sample) | 1.9% | 2.3% |
| Standard Deviation (Population) | 1.9% | 2.3% |
Similar Demographics by Kindergarten
Demographics Similar to Immigrants from Malaysia by Kindergarten
In terms of kindergarten, the demographic groups most similar to Immigrants from Malaysia are Immigrants from Pakistan (97.7%, a difference of 0.0%), Colombian (97.7%, a difference of 0.0%), Immigrants from Western Asia (97.7%, a difference of 0.0%), Immigrants from Uruguay (97.7%, a difference of 0.010%), and Puerto Rican (97.7%, a difference of 0.020%).
| Demographics | Rating | Rank | Kindergarten |
| Immigrants | Costa Rica | 3.6 /100 | #227 | Tragic 97.7% |
| Sub-Saharan Africans | 3.5 /100 | #228 | Tragic 97.7% |
| Sierra Leoneans | 3.4 /100 | #229 | Tragic 97.7% |
| Senegalese | 3.3 /100 | #230 | Tragic 97.7% |
| Puerto Ricans | 2.7 /100 | #231 | Tragic 97.7% |
| Immigrants | Uruguay | 2.6 /100 | #232 | Tragic 97.7% |
| Immigrants | Pakistan | 2.2 /100 | #233 | Tragic 97.7% |
| Immigrants | Malaysia | 2.2 /100 | #234 | Tragic 97.7% |
| Colombians | 2.2 /100 | #235 | Tragic 97.7% |
| Immigrants | Western Asia | 2.1 /100 | #236 | Tragic 97.7% |
| Nigerians | 1.8 /100 | #237 | Tragic 97.6% |
| Immigrants | Eastern Asia | 1.7 /100 | #238 | Tragic 97.6% |
| U.S. Virgin Islanders | 1.7 /100 | #239 | Tragic 97.6% |
| Koreans | 1.6 /100 | #240 | Tragic 97.6% |
| Liberians | 1.3 /100 | #241 | Tragic 97.6% |
Demographics Similar to Central Americans by Kindergarten
In terms of kindergarten, the demographic groups most similar to Central Americans are Yakama (96.6%, a difference of 0.020%), Immigrants from Dominican Republic (96.6%, a difference of 0.020%), Bangladeshi (96.6%, a difference of 0.030%), Immigrants from Armenia (96.6%, a difference of 0.040%), and Guatemalan (96.5%, a difference of 0.060%).
| Demographics | Rating | Rank | Kindergarten |
| Dominicans | 0.0 /100 | #326 | Tragic 96.8% |
| Mexicans | 0.0 /100 | #327 | Tragic 96.7% |
| Immigrants | Latin America | 0.0 /100 | #328 | Tragic 96.7% |
| Immigrants | Vietnam | 0.0 /100 | #329 | Tragic 96.7% |
| Japanese | 0.0 /100 | #330 | Tragic 96.7% |
| Immigrants | Armenia | 0.0 /100 | #331 | Tragic 96.6% |
| Yakama | 0.0 /100 | #332 | Tragic 96.6% |
| Central Americans | 0.0 /100 | #333 | Tragic 96.6% |
| Immigrants | Dominican Republic | 0.0 /100 | #334 | Tragic 96.6% |
| Bangladeshis | 0.0 /100 | #335 | Tragic 96.6% |
| Guatemalans | 0.0 /100 | #336 | Tragic 96.5% |
| Immigrants | Cambodia | 0.0 /100 | #337 | Tragic 96.5% |
| Immigrants | Fiji | 0.0 /100 | #338 | Tragic 96.5% |
| Immigrants | Guatemala | 0.0 /100 | #339 | Tragic 96.4% |
| Immigrants | Central America | 0.0 /100 | #340 | Tragic 96.4% |