Finnish vs Central American Kindergarten
COMPARE
Finnish
Central American
Kindergarten
Kindergarten Comparison
Finns
Central Americans
98.6%
KINDERGARTEN
100.0/ 100
METRIC RATING
22nd/ 347
METRIC RANK
96.6%
KINDERGARTEN
0.0/ 100
METRIC RATING
333rd/ 347
METRIC RANK
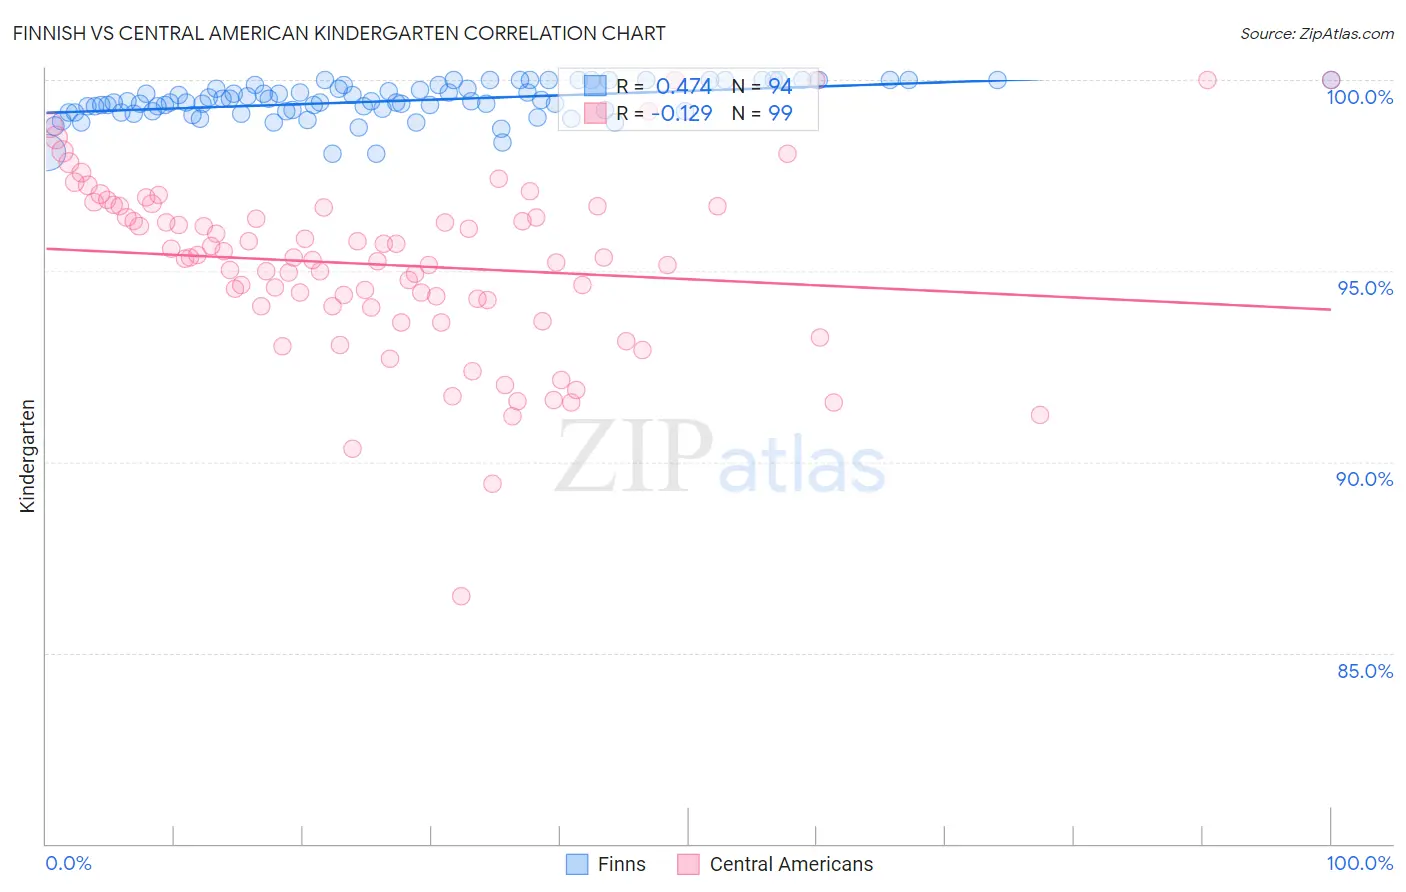
Finnish vs Central American Kindergarten Correlation Chart
The statistical analysis conducted on geographies consisting of 404,675,516 people shows a moderate positive correlation between the proportion of Finns and percentage of population with at least kindergarten education in the United States with a correlation coefficient (R) of 0.474 and weighted average of 98.6%. Similarly, the statistical analysis conducted on geographies consisting of 504,619,275 people shows a poor negative correlation between the proportion of Central Americans and percentage of population with at least kindergarten education in the United States with a correlation coefficient (R) of -0.129 and weighted average of 96.6%, a difference of 2.1%.
Kindergarten Correlation Summary
| Measurement | Finnish | Central American |
| Minimum | 98.1% | 86.5% |
| Maximum | 100.0% | 100.0% |
| Range | 1.9% | 13.5% |
| Mean | 99.4% | 95.2% |
| Median | 99.4% | 95.3% |
| Interquartile 25% (IQ1) | 99.2% | 94.1% |
| Interquartile 75% (IQ3) | 99.9% | 96.7% |
| Interquartile Range (IQR) | 0.68% | 2.6% |
| Standard Deviation (Sample) | 0.46% | 2.3% |
| Standard Deviation (Population) | 0.46% | 2.3% |
Similar Demographics by Kindergarten
Demographics Similar to Finns by Kindergarten
In terms of kindergarten, the demographic groups most similar to Finns are Pennsylvania German (98.6%, a difference of 0.0%), Lithuanian (98.6%, a difference of 0.0%), Arapaho (98.6%, a difference of 0.0%), Danish (98.6%, a difference of 0.0%), and Sioux (98.6%, a difference of 0.0%).
| Demographics | Rating | Rank | Kindergarten |
| Swedes | 100.0 /100 | #15 | Exceptional 98.7% |
| Aleuts | 100.0 /100 | #16 | Exceptional 98.6% |
| Scottish | 100.0 /100 | #17 | Exceptional 98.6% |
| Dutch | 100.0 /100 | #18 | Exceptional 98.6% |
| Irish | 100.0 /100 | #19 | Exceptional 98.6% |
| Pennsylvania Germans | 100.0 /100 | #20 | Exceptional 98.6% |
| Lithuanians | 100.0 /100 | #21 | Exceptional 98.6% |
| Finns | 100.0 /100 | #22 | Exceptional 98.6% |
| Arapaho | 100.0 /100 | #23 | Exceptional 98.6% |
| Danes | 100.0 /100 | #24 | Exceptional 98.6% |
| Sioux | 100.0 /100 | #25 | Exceptional 98.6% |
| Poles | 100.0 /100 | #26 | Exceptional 98.6% |
| Scotch-Irish | 100.0 /100 | #27 | Exceptional 98.6% |
| Croatians | 100.0 /100 | #28 | Exceptional 98.6% |
| French | 100.0 /100 | #29 | Exceptional 98.6% |
Demographics Similar to Central Americans by Kindergarten
In terms of kindergarten, the demographic groups most similar to Central Americans are Yakama (96.6%, a difference of 0.020%), Immigrants from Dominican Republic (96.6%, a difference of 0.020%), Bangladeshi (96.6%, a difference of 0.030%), Immigrants from Armenia (96.6%, a difference of 0.040%), and Guatemalan (96.5%, a difference of 0.060%).
| Demographics | Rating | Rank | Kindergarten |
| Dominicans | 0.0 /100 | #326 | Tragic 96.8% |
| Mexicans | 0.0 /100 | #327 | Tragic 96.7% |
| Immigrants | Latin America | 0.0 /100 | #328 | Tragic 96.7% |
| Immigrants | Vietnam | 0.0 /100 | #329 | Tragic 96.7% |
| Japanese | 0.0 /100 | #330 | Tragic 96.7% |
| Immigrants | Armenia | 0.0 /100 | #331 | Tragic 96.6% |
| Yakama | 0.0 /100 | #332 | Tragic 96.6% |
| Central Americans | 0.0 /100 | #333 | Tragic 96.6% |
| Immigrants | Dominican Republic | 0.0 /100 | #334 | Tragic 96.6% |
| Bangladeshis | 0.0 /100 | #335 | Tragic 96.6% |
| Guatemalans | 0.0 /100 | #336 | Tragic 96.5% |
| Immigrants | Cambodia | 0.0 /100 | #337 | Tragic 96.5% |
| Immigrants | Fiji | 0.0 /100 | #338 | Tragic 96.5% |
| Immigrants | Guatemala | 0.0 /100 | #339 | Tragic 96.4% |
| Immigrants | Central America | 0.0 /100 | #340 | Tragic 96.4% |