Immigrants from Malaysia vs Shoshone 10th Grade
COMPARE
Immigrants from Malaysia
Shoshone
10th Grade
10th Grade Comparison
Immigrants from Malaysia
Shoshone
93.5%
10TH GRADE
28.0/ 100
METRIC RATING
192nd/ 347
METRIC RANK
94.2%
10TH GRADE
90.8/ 100
METRIC RATING
136th/ 347
METRIC RANK
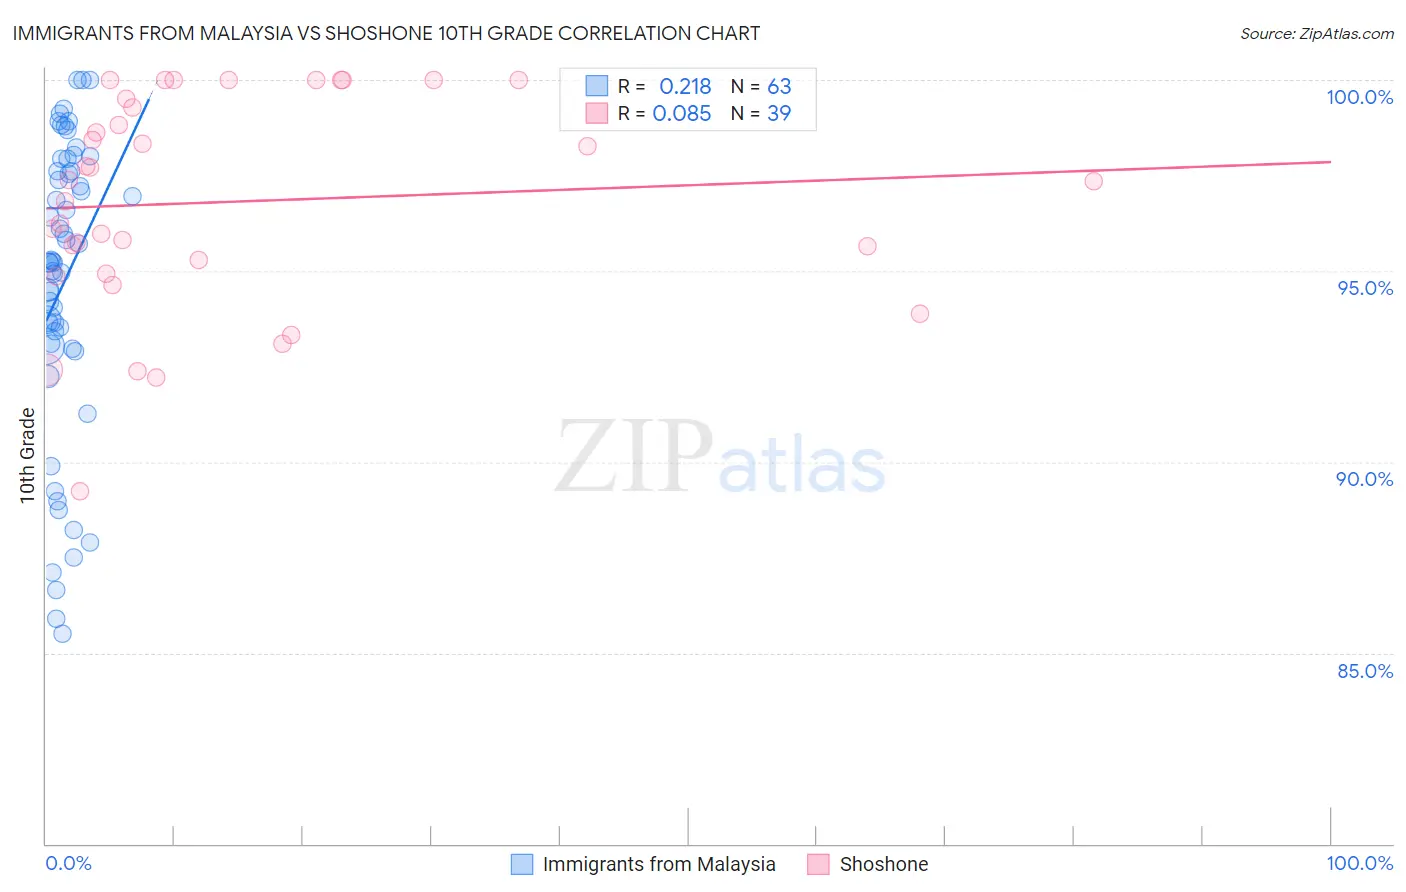
Immigrants from Malaysia vs Shoshone 10th Grade Correlation Chart
The statistical analysis conducted on geographies consisting of 197,867,328 people shows a weak positive correlation between the proportion of Immigrants from Malaysia and percentage of population with at least 10th grade education in the United States with a correlation coefficient (R) of 0.218 and weighted average of 93.5%. Similarly, the statistical analysis conducted on geographies consisting of 66,625,086 people shows a slight positive correlation between the proportion of Shoshone and percentage of population with at least 10th grade education in the United States with a correlation coefficient (R) of 0.085 and weighted average of 94.2%, a difference of 0.72%.
10th Grade Correlation Summary
| Measurement | Immigrants from Malaysia | Shoshone |
| Minimum | 85.5% | 89.2% |
| Maximum | 100.0% | 100.0% |
| Range | 14.5% | 10.8% |
| Mean | 94.7% | 96.8% |
| Median | 95.2% | 97.3% |
| Interquartile 25% (IQ1) | 93.0% | 94.9% |
| Interquartile 75% (IQ3) | 97.6% | 99.5% |
| Interquartile Range (IQR) | 4.6% | 4.6% |
| Standard Deviation (Sample) | 3.8% | 2.8% |
| Standard Deviation (Population) | 3.8% | 2.7% |
Similar Demographics by 10th Grade
Demographics Similar to Immigrants from Malaysia by 10th Grade
In terms of 10th grade, the demographic groups most similar to Immigrants from Malaysia are Panamanian (93.5%, a difference of 0.0%), Immigrants from Morocco (93.5%, a difference of 0.010%), Cheyenne (93.5%, a difference of 0.010%), Yup'ik (93.6%, a difference of 0.030%), and Moroccan (93.5%, a difference of 0.030%).
| Demographics | Rating | Rank | 10th Grade |
| Sudanese | 36.6 /100 | #185 | Fair 93.6% |
| Immigrants | Eastern Asia | 35.1 /100 | #186 | Fair 93.6% |
| Liberians | 34.7 /100 | #187 | Fair 93.6% |
| Marshallese | 33.2 /100 | #188 | Fair 93.6% |
| Immigrants | Pakistan | 32.5 /100 | #189 | Fair 93.6% |
| Laotians | 32.1 /100 | #190 | Fair 93.6% |
| Yup'ik | 31.1 /100 | #191 | Fair 93.6% |
| Immigrants | Malaysia | 28.0 /100 | #192 | Fair 93.5% |
| Panamanians | 28.0 /100 | #193 | Fair 93.5% |
| Immigrants | Morocco | 26.9 /100 | #194 | Fair 93.5% |
| Cheyenne | 26.8 /100 | #195 | Fair 93.5% |
| Moroccans | 25.3 /100 | #196 | Fair 93.5% |
| Pueblo | 23.9 /100 | #197 | Fair 93.5% |
| Immigrants | Micronesia | 23.2 /100 | #198 | Fair 93.5% |
| Asians | 23.0 /100 | #199 | Fair 93.5% |
Demographics Similar to Shoshone by 10th Grade
In terms of 10th grade, the demographic groups most similar to Shoshone are Immigrants from Korea (94.2%, a difference of 0.010%), Arapaho (94.2%, a difference of 0.010%), Immigrants from Sri Lanka (94.2%, a difference of 0.020%), Creek (94.2%, a difference of 0.030%), and Osage (94.2%, a difference of 0.030%).
| Demographics | Rating | Rank | 10th Grade |
| Iroquois | 92.8 /100 | #129 | Exceptional 94.3% |
| Immigrants | Greece | 92.7 /100 | #130 | Exceptional 94.3% |
| Immigrants | Eastern Europe | 92.5 /100 | #131 | Exceptional 94.3% |
| Immigrants | Russia | 92.4 /100 | #132 | Exceptional 94.3% |
| Creek | 91.9 /100 | #133 | Exceptional 94.2% |
| Osage | 91.7 /100 | #134 | Exceptional 94.2% |
| Immigrants | Korea | 91.3 /100 | #135 | Exceptional 94.2% |
| Shoshone | 90.8 /100 | #136 | Exceptional 94.2% |
| Arapaho | 90.5 /100 | #137 | Exceptional 94.2% |
| Immigrants | Sri Lanka | 89.9 /100 | #138 | Excellent 94.2% |
| Immigrants | Bosnia and Herzegovina | 89.4 /100 | #139 | Excellent 94.2% |
| Immigrants | Jordan | 87.6 /100 | #140 | Excellent 94.1% |
| Hmong | 86.6 /100 | #141 | Excellent 94.1% |
| Albanians | 86.5 /100 | #142 | Excellent 94.1% |
| Cherokee | 84.9 /100 | #143 | Excellent 94.1% |