Immigrants from Lithuania vs Polish 4th Grade
COMPARE
Immigrants from Lithuania
Polish
4th Grade
4th Grade Comparison
Immigrants from Lithuania
Poles
98.0%
4TH GRADE
99.3/ 100
METRIC RATING
77th/ 347
METRIC RANK
98.4%
4TH GRADE
100.0/ 100
METRIC RATING
18th/ 347
METRIC RANK
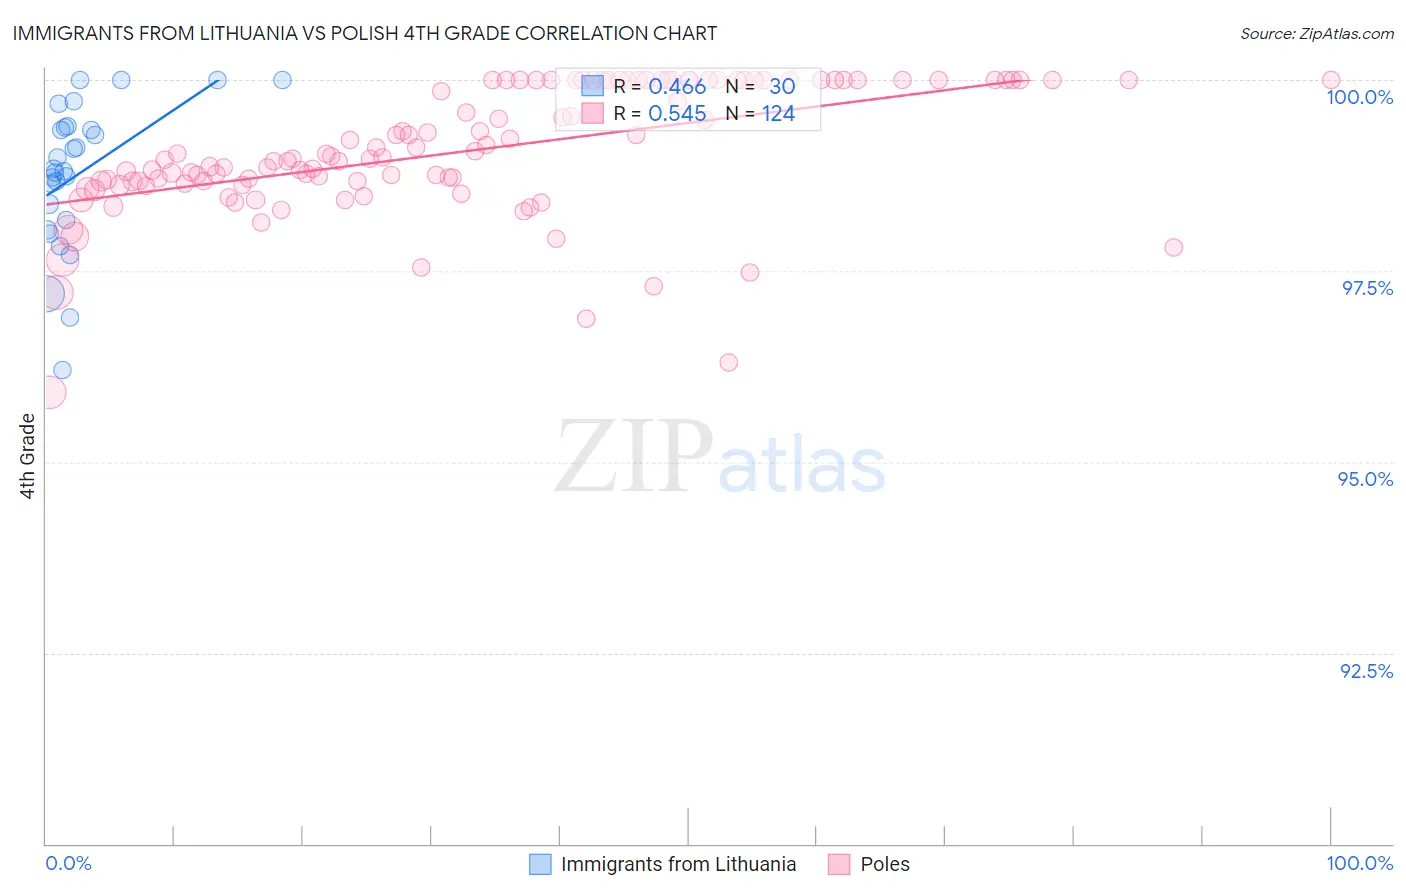
Immigrants from Lithuania vs Polish 4th Grade Correlation Chart
The statistical analysis conducted on geographies consisting of 117,724,932 people shows a moderate positive correlation between the proportion of Immigrants from Lithuania and percentage of population with at least 4th grade education in the United States with a correlation coefficient (R) of 0.466 and weighted average of 98.0%. Similarly, the statistical analysis conducted on geographies consisting of 560,594,514 people shows a substantial positive correlation between the proportion of Poles and percentage of population with at least 4th grade education in the United States with a correlation coefficient (R) of 0.545 and weighted average of 98.4%, a difference of 0.40%.
4th Grade Correlation Summary
| Measurement | Immigrants from Lithuania | Polish |
| Minimum | 96.2% | 95.9% |
| Maximum | 100.0% | 100.0% |
| Range | 3.8% | 4.1% |
| Mean | 98.8% | 99.1% |
| Median | 98.8% | 99.0% |
| Interquartile 25% (IQ1) | 98.2% | 98.7% |
| Interquartile 75% (IQ3) | 99.4% | 100.0% |
| Interquartile Range (IQR) | 1.2% | 1.3% |
| Standard Deviation (Sample) | 0.95% | 0.84% |
| Standard Deviation (Population) | 0.93% | 0.84% |
Similar Demographics by 4th Grade
Demographics Similar to Immigrants from Lithuania by 4th Grade
In terms of 4th grade, the demographic groups most similar to Immigrants from Lithuania are Immigrants from Netherlands (98.0%, a difference of 0.0%), Cherokee (98.0%, a difference of 0.0%), Immigrants from England (98.0%, a difference of 0.0%), Ukrainian (98.0%, a difference of 0.010%), and Osage (98.0%, a difference of 0.010%).
| Demographics | Rating | Rank | 4th Grade |
| Immigrants | Austria | 99.6 /100 | #70 | Exceptional 98.0% |
| Lumbee | 99.6 /100 | #71 | Exceptional 98.0% |
| Iranians | 99.4 /100 | #72 | Exceptional 98.0% |
| Macedonians | 99.4 /100 | #73 | Exceptional 98.0% |
| Chickasaw | 99.4 /100 | #74 | Exceptional 98.0% |
| Immigrants | Netherlands | 99.3 /100 | #75 | Exceptional 98.0% |
| Cherokee | 99.3 /100 | #76 | Exceptional 98.0% |
| Immigrants | Lithuania | 99.3 /100 | #77 | Exceptional 98.0% |
| Immigrants | England | 99.3 /100 | #78 | Exceptional 98.0% |
| Ukrainians | 99.2 /100 | #79 | Exceptional 98.0% |
| Osage | 99.2 /100 | #80 | Exceptional 98.0% |
| Immigrants | India | 99.1 /100 | #81 | Exceptional 98.0% |
| Icelanders | 99.1 /100 | #82 | Exceptional 98.0% |
| Immigrants | Belgium | 99.0 /100 | #83 | Exceptional 97.9% |
| Cypriots | 98.9 /100 | #84 | Exceptional 97.9% |
Demographics Similar to Poles by 4th Grade
In terms of 4th grade, the demographic groups most similar to Poles are Irish (98.4%, a difference of 0.0%), Dutch (98.4%, a difference of 0.010%), Scottish (98.4%, a difference of 0.010%), Pennsylvania German (98.4%, a difference of 0.010%), and Alaska Native (98.4%, a difference of 0.010%).
| Demographics | Rating | Rank | 4th Grade |
| English | 100.0 /100 | #11 | Exceptional 98.4% |
| Tlingit-Haida | 100.0 /100 | #12 | Exceptional 98.4% |
| Swedes | 100.0 /100 | #13 | Exceptional 98.4% |
| Carpatho Rusyns | 100.0 /100 | #14 | Exceptional 98.4% |
| Dutch | 100.0 /100 | #15 | Exceptional 98.4% |
| Scottish | 100.0 /100 | #16 | Exceptional 98.4% |
| Pennsylvania Germans | 100.0 /100 | #17 | Exceptional 98.4% |
| Poles | 100.0 /100 | #18 | Exceptional 98.4% |
| Irish | 100.0 /100 | #19 | Exceptional 98.4% |
| Alaska Natives | 100.0 /100 | #20 | Exceptional 98.4% |
| Lithuanians | 100.0 /100 | #21 | Exceptional 98.3% |
| Finns | 100.0 /100 | #22 | Exceptional 98.3% |
| Sioux | 100.0 /100 | #23 | Exceptional 98.3% |
| Danes | 100.0 /100 | #24 | Exceptional 98.3% |
| Scotch-Irish | 100.0 /100 | #25 | Exceptional 98.3% |