Immigrants from Lithuania vs Iraqi 4th Grade
COMPARE
Immigrants from Lithuania
Iraqi
4th Grade
4th Grade Comparison
Immigrants from Lithuania
Iraqis
98.0%
4TH GRADE
99.3/ 100
METRIC RATING
77th/ 347
METRIC RANK
97.3%
4TH GRADE
6.3/ 100
METRIC RATING
218th/ 347
METRIC RANK
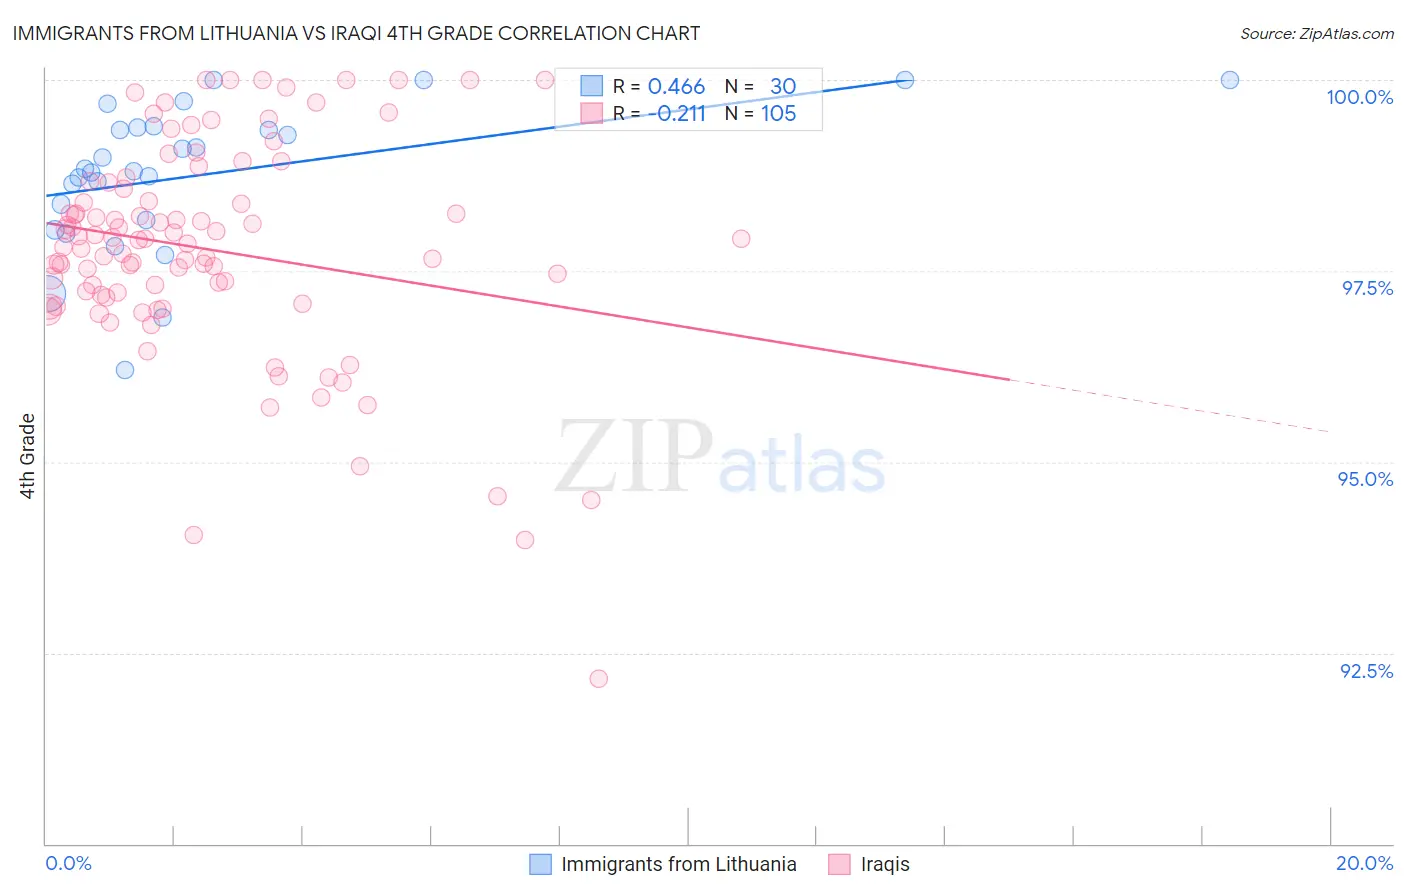
Immigrants from Lithuania vs Iraqi 4th Grade Correlation Chart
The statistical analysis conducted on geographies consisting of 117,724,932 people shows a moderate positive correlation between the proportion of Immigrants from Lithuania and percentage of population with at least 4th grade education in the United States with a correlation coefficient (R) of 0.466 and weighted average of 98.0%. Similarly, the statistical analysis conducted on geographies consisting of 170,614,457 people shows a weak negative correlation between the proportion of Iraqis and percentage of population with at least 4th grade education in the United States with a correlation coefficient (R) of -0.211 and weighted average of 97.3%, a difference of 0.72%.
4th Grade Correlation Summary
| Measurement | Immigrants from Lithuania | Iraqi |
| Minimum | 96.2% | 92.2% |
| Maximum | 100.0% | 100.0% |
| Range | 3.8% | 7.8% |
| Mean | 98.8% | 97.8% |
| Median | 98.8% | 97.9% |
| Interquartile 25% (IQ1) | 98.2% | 97.2% |
| Interquartile 75% (IQ3) | 99.4% | 98.6% |
| Interquartile Range (IQR) | 1.2% | 1.5% |
| Standard Deviation (Sample) | 0.95% | 1.4% |
| Standard Deviation (Population) | 0.93% | 1.4% |
Similar Demographics by 4th Grade
Demographics Similar to Immigrants from Lithuania by 4th Grade
In terms of 4th grade, the demographic groups most similar to Immigrants from Lithuania are Immigrants from Netherlands (98.0%, a difference of 0.0%), Cherokee (98.0%, a difference of 0.0%), Immigrants from England (98.0%, a difference of 0.0%), Ukrainian (98.0%, a difference of 0.010%), and Osage (98.0%, a difference of 0.010%).
| Demographics | Rating | Rank | 4th Grade |
| Immigrants | Austria | 99.6 /100 | #70 | Exceptional 98.0% |
| Lumbee | 99.6 /100 | #71 | Exceptional 98.0% |
| Iranians | 99.4 /100 | #72 | Exceptional 98.0% |
| Macedonians | 99.4 /100 | #73 | Exceptional 98.0% |
| Chickasaw | 99.4 /100 | #74 | Exceptional 98.0% |
| Immigrants | Netherlands | 99.3 /100 | #75 | Exceptional 98.0% |
| Cherokee | 99.3 /100 | #76 | Exceptional 98.0% |
| Immigrants | Lithuania | 99.3 /100 | #77 | Exceptional 98.0% |
| Immigrants | England | 99.3 /100 | #78 | Exceptional 98.0% |
| Ukrainians | 99.2 /100 | #79 | Exceptional 98.0% |
| Osage | 99.2 /100 | #80 | Exceptional 98.0% |
| Immigrants | India | 99.1 /100 | #81 | Exceptional 98.0% |
| Icelanders | 99.1 /100 | #82 | Exceptional 98.0% |
| Immigrants | Belgium | 99.0 /100 | #83 | Exceptional 97.9% |
| Cypriots | 98.9 /100 | #84 | Exceptional 97.9% |
Demographics Similar to Iraqis by 4th Grade
In terms of 4th grade, the demographic groups most similar to Iraqis are Sierra Leonean (97.3%, a difference of 0.0%), Immigrants from Morocco (97.3%, a difference of 0.010%), Samoan (97.3%, a difference of 0.010%), Tongan (97.3%, a difference of 0.010%), and South American Indian (97.3%, a difference of 0.010%).
| Demographics | Rating | Rank | 4th Grade |
| Sudanese | 9.0 /100 | #211 | Tragic 97.3% |
| Tohono O'odham | 8.4 /100 | #212 | Tragic 97.3% |
| Costa Ricans | 8.3 /100 | #213 | Tragic 97.3% |
| Immigrants | Nepal | 7.7 /100 | #214 | Tragic 97.3% |
| Immigrants | Morocco | 7.1 /100 | #215 | Tragic 97.3% |
| Samoans | 6.8 /100 | #216 | Tragic 97.3% |
| Sierra Leoneans | 6.5 /100 | #217 | Tragic 97.3% |
| Iraqis | 6.3 /100 | #218 | Tragic 97.3% |
| Tongans | 5.8 /100 | #219 | Tragic 97.3% |
| South American Indians | 5.5 /100 | #220 | Tragic 97.3% |
| Immigrants | Panama | 5.4 /100 | #221 | Tragic 97.3% |
| Immigrants | Lebanon | 5.1 /100 | #222 | Tragic 97.3% |
| Immigrants | Sudan | 5.0 /100 | #223 | Tragic 97.2% |
| Immigrants | Syria | 5.0 /100 | #224 | Tragic 97.2% |
| Immigrants | Iraq | 4.6 /100 | #225 | Tragic 97.2% |