Immigrants from Poland vs Iraqi 4th Grade
COMPARE
Immigrants from Poland
Iraqi
4th Grade
4th Grade Comparison
Immigrants from Poland
Iraqis
97.5%
4TH GRADE
55.9/ 100
METRIC RATING
167th/ 347
METRIC RANK
97.3%
4TH GRADE
6.3/ 100
METRIC RATING
218th/ 347
METRIC RANK
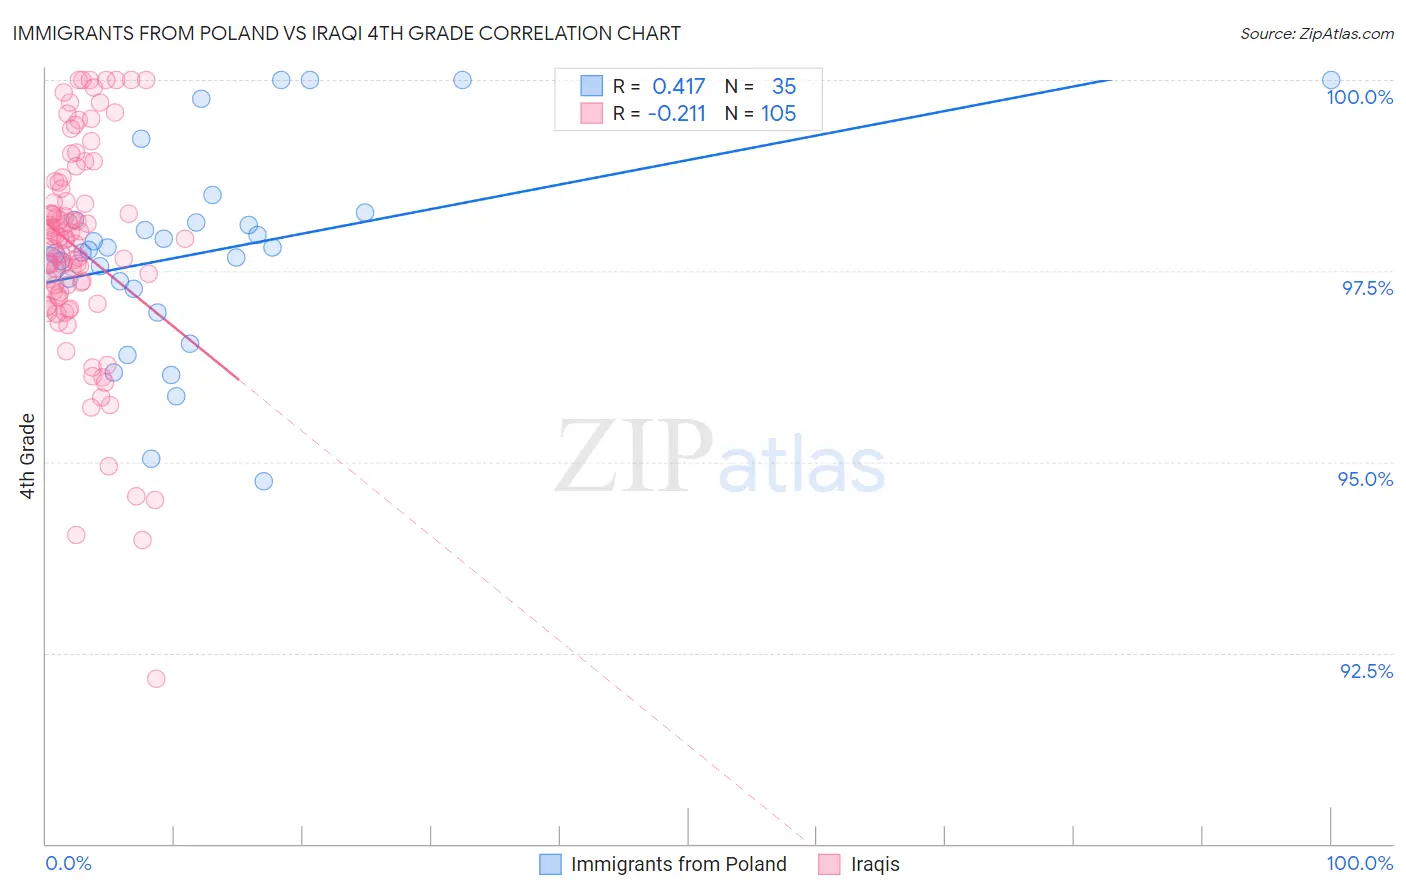
Immigrants from Poland vs Iraqi 4th Grade Correlation Chart
The statistical analysis conducted on geographies consisting of 304,861,559 people shows a moderate positive correlation between the proportion of Immigrants from Poland and percentage of population with at least 4th grade education in the United States with a correlation coefficient (R) of 0.417 and weighted average of 97.5%. Similarly, the statistical analysis conducted on geographies consisting of 170,614,457 people shows a weak negative correlation between the proportion of Iraqis and percentage of population with at least 4th grade education in the United States with a correlation coefficient (R) of -0.211 and weighted average of 97.3%, a difference of 0.28%.
4th Grade Correlation Summary
| Measurement | Immigrants from Poland | Iraqi |
| Minimum | 94.8% | 92.2% |
| Maximum | 100.0% | 100.0% |
| Range | 5.2% | 7.8% |
| Mean | 97.7% | 97.8% |
| Median | 97.8% | 97.9% |
| Interquartile 25% (IQ1) | 97.3% | 97.2% |
| Interquartile 75% (IQ3) | 98.2% | 98.6% |
| Interquartile Range (IQR) | 0.90% | 1.5% |
| Standard Deviation (Sample) | 1.3% | 1.4% |
| Standard Deviation (Population) | 1.3% | 1.4% |
Similar Demographics by 4th Grade
Demographics Similar to Immigrants from Poland by 4th Grade
In terms of 4th grade, the demographic groups most similar to Immigrants from Poland are Kenyan (97.5%, a difference of 0.0%), Immigrants from Belarus (97.5%, a difference of 0.0%), Ugandan (97.6%, a difference of 0.010%), Venezuelan (97.6%, a difference of 0.010%), and Chilean (97.5%, a difference of 0.010%).
| Demographics | Rating | Rank | 4th Grade |
| Apache | 61.3 /100 | #160 | Good 97.6% |
| Marshallese | 60.8 /100 | #161 | Good 97.6% |
| Bermudans | 60.5 /100 | #162 | Good 97.6% |
| Immigrants | Iran | 60.3 /100 | #163 | Good 97.6% |
| Ugandans | 58.9 /100 | #164 | Average 97.6% |
| Venezuelans | 58.7 /100 | #165 | Average 97.6% |
| Kenyans | 56.5 /100 | #166 | Average 97.5% |
| Immigrants | Poland | 55.9 /100 | #167 | Average 97.5% |
| Immigrants | Belarus | 55.8 /100 | #168 | Average 97.5% |
| Chileans | 54.4 /100 | #169 | Average 97.5% |
| Immigrants | Spain | 51.8 /100 | #170 | Average 97.5% |
| Brazilians | 51.5 /100 | #171 | Average 97.5% |
| Immigrants | Sri Lanka | 51.1 /100 | #172 | Average 97.5% |
| Immigrants | Korea | 50.6 /100 | #173 | Average 97.5% |
| Egyptians | 50.0 /100 | #174 | Average 97.5% |
Demographics Similar to Iraqis by 4th Grade
In terms of 4th grade, the demographic groups most similar to Iraqis are Sierra Leonean (97.3%, a difference of 0.0%), Immigrants from Morocco (97.3%, a difference of 0.010%), Samoan (97.3%, a difference of 0.010%), Tongan (97.3%, a difference of 0.010%), and South American Indian (97.3%, a difference of 0.010%).
| Demographics | Rating | Rank | 4th Grade |
| Sudanese | 9.0 /100 | #211 | Tragic 97.3% |
| Tohono O'odham | 8.4 /100 | #212 | Tragic 97.3% |
| Costa Ricans | 8.3 /100 | #213 | Tragic 97.3% |
| Immigrants | Nepal | 7.7 /100 | #214 | Tragic 97.3% |
| Immigrants | Morocco | 7.1 /100 | #215 | Tragic 97.3% |
| Samoans | 6.8 /100 | #216 | Tragic 97.3% |
| Sierra Leoneans | 6.5 /100 | #217 | Tragic 97.3% |
| Iraqis | 6.3 /100 | #218 | Tragic 97.3% |
| Tongans | 5.8 /100 | #219 | Tragic 97.3% |
| South American Indians | 5.5 /100 | #220 | Tragic 97.3% |
| Immigrants | Panama | 5.4 /100 | #221 | Tragic 97.3% |
| Immigrants | Lebanon | 5.1 /100 | #222 | Tragic 97.3% |
| Immigrants | Sudan | 5.0 /100 | #223 | Tragic 97.2% |
| Immigrants | Syria | 5.0 /100 | #224 | Tragic 97.2% |
| Immigrants | Iraq | 4.6 /100 | #225 | Tragic 97.2% |