Immigrants from Lithuania vs Hopi GED/Equivalency
COMPARE
Immigrants from Lithuania
Hopi
GED/Equivalency
GED/Equivalency Comparison
Immigrants from Lithuania
Hopi
88.6%
GED/EQUIVALENCY
99.8/ 100
METRIC RATING
27th/ 347
METRIC RANK
83.0%
GED/EQUIVALENCY
0.2/ 100
METRIC RATING
269th/ 347
METRIC RANK
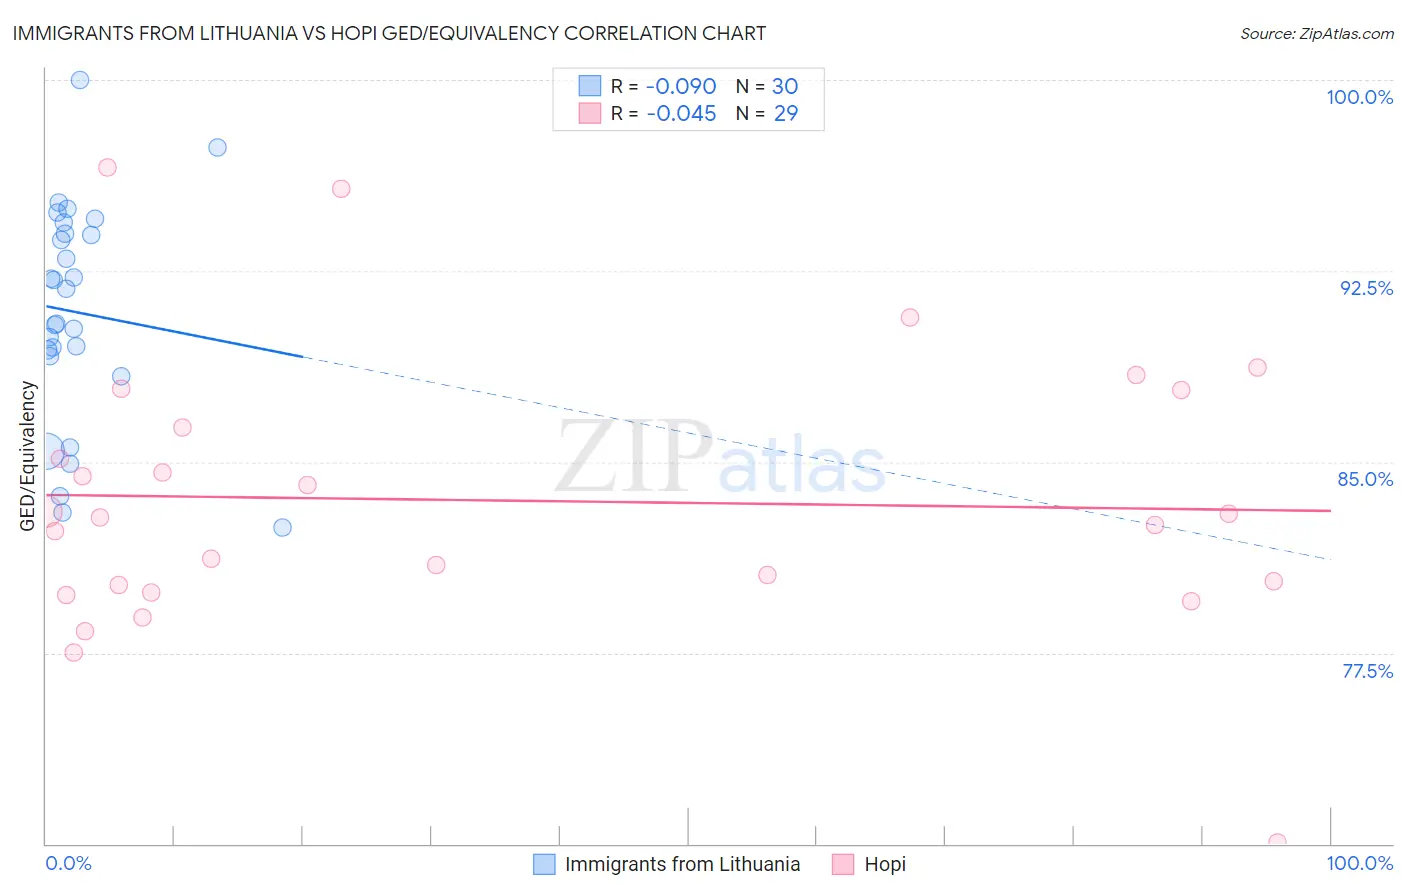
Immigrants from Lithuania vs Hopi GED/Equivalency Correlation Chart
The statistical analysis conducted on geographies consisting of 117,724,932 people shows a slight negative correlation between the proportion of Immigrants from Lithuania and percentage of population with at least ged/equivalency education in the United States with a correlation coefficient (R) of -0.090 and weighted average of 88.6%. Similarly, the statistical analysis conducted on geographies consisting of 74,739,957 people shows no correlation between the proportion of Hopi and percentage of population with at least ged/equivalency education in the United States with a correlation coefficient (R) of -0.045 and weighted average of 83.0%, a difference of 6.7%.
GED/Equivalency Correlation Summary
| Measurement | Immigrants from Lithuania | Hopi |
| Minimum | 82.4% | 70.0% |
| Maximum | 100.0% | 96.6% |
| Range | 17.6% | 26.5% |
| Mean | 90.9% | 83.5% |
| Median | 91.1% | 82.8% |
| Interquartile 25% (IQ1) | 89.2% | 80.0% |
| Interquartile 75% (IQ3) | 94.0% | 87.1% |
| Interquartile Range (IQR) | 4.8% | 7.1% |
| Standard Deviation (Sample) | 4.3% | 5.4% |
| Standard Deviation (Population) | 4.2% | 5.3% |
Similar Demographics by GED/Equivalency
Demographics Similar to Immigrants from Lithuania by GED/Equivalency
In terms of ged/equivalency, the demographic groups most similar to Immigrants from Lithuania are Immigrants from Australia (88.6%, a difference of 0.030%), Russian (88.6%, a difference of 0.040%), Slovak (88.6%, a difference of 0.040%), Estonian (88.6%, a difference of 0.040%), and Immigrants from Northern Europe (88.5%, a difference of 0.040%).
| Demographics | Rating | Rank | GED/Equivalency |
| Maltese | 99.9 /100 | #20 | Exceptional 88.6% |
| Luxembourgers | 99.8 /100 | #21 | Exceptional 88.6% |
| Immigrants | Ireland | 99.8 /100 | #22 | Exceptional 88.6% |
| Russians | 99.8 /100 | #23 | Exceptional 88.6% |
| Slovaks | 99.8 /100 | #24 | Exceptional 88.6% |
| Estonians | 99.8 /100 | #25 | Exceptional 88.6% |
| Immigrants | Australia | 99.8 /100 | #26 | Exceptional 88.6% |
| Immigrants | Lithuania | 99.8 /100 | #27 | Exceptional 88.6% |
| Immigrants | Northern Europe | 99.8 /100 | #28 | Exceptional 88.5% |
| Poles | 99.8 /100 | #29 | Exceptional 88.5% |
| Turks | 99.8 /100 | #30 | Exceptional 88.5% |
| Bhutanese | 99.8 /100 | #31 | Exceptional 88.4% |
| Danes | 99.8 /100 | #32 | Exceptional 88.4% |
| Immigrants | Sweden | 99.7 /100 | #33 | Exceptional 88.4% |
| Immigrants | Japan | 99.7 /100 | #34 | Exceptional 88.4% |
Demographics Similar to Hopi by GED/Equivalency
In terms of ged/equivalency, the demographic groups most similar to Hopi are Immigrants from Burma/Myanmar (83.0%, a difference of 0.040%), Immigrants from Jamaica (82.9%, a difference of 0.050%), Trinidadian and Tobagonian (83.0%, a difference of 0.080%), U.S. Virgin Islander (82.9%, a difference of 0.090%), and Kiowa (83.1%, a difference of 0.10%).
| Demographics | Rating | Rank | GED/Equivalency |
| Immigrants | Armenia | 0.2 /100 | #262 | Tragic 83.1% |
| Immigrants | Congo | 0.2 /100 | #263 | Tragic 83.1% |
| Bangladeshis | 0.2 /100 | #264 | Tragic 83.1% |
| West Indians | 0.2 /100 | #265 | Tragic 83.1% |
| Kiowa | 0.2 /100 | #266 | Tragic 83.1% |
| Trinidadians and Tobagonians | 0.2 /100 | #267 | Tragic 83.0% |
| Immigrants | Burma/Myanmar | 0.2 /100 | #268 | Tragic 83.0% |
| Hopi | 0.2 /100 | #269 | Tragic 83.0% |
| Immigrants | Jamaica | 0.2 /100 | #270 | Tragic 82.9% |
| U.S. Virgin Islanders | 0.2 /100 | #271 | Tragic 82.9% |
| Barbadians | 0.1 /100 | #272 | Tragic 82.9% |
| Pennsylvania Germans | 0.1 /100 | #273 | Tragic 82.9% |
| Immigrants | Trinidad and Tobago | 0.1 /100 | #274 | Tragic 82.8% |
| Seminole | 0.1 /100 | #275 | Tragic 82.8% |
| Blacks/African Americans | 0.1 /100 | #276 | Tragic 82.8% |