Immigrants from Lebanon vs Nicaraguan No Schooling Completed
COMPARE
Immigrants from Lebanon
Nicaraguan
No Schooling Completed
No Schooling Completed Comparison
Immigrants from Lebanon
Nicaraguans
2.3%
NO SCHOOLING COMPLETED
4.5/ 100
METRIC RATING
223rd/ 347
METRIC RANK
2.9%
NO SCHOOLING COMPLETED
0.0/ 100
METRIC RATING
304th/ 347
METRIC RANK
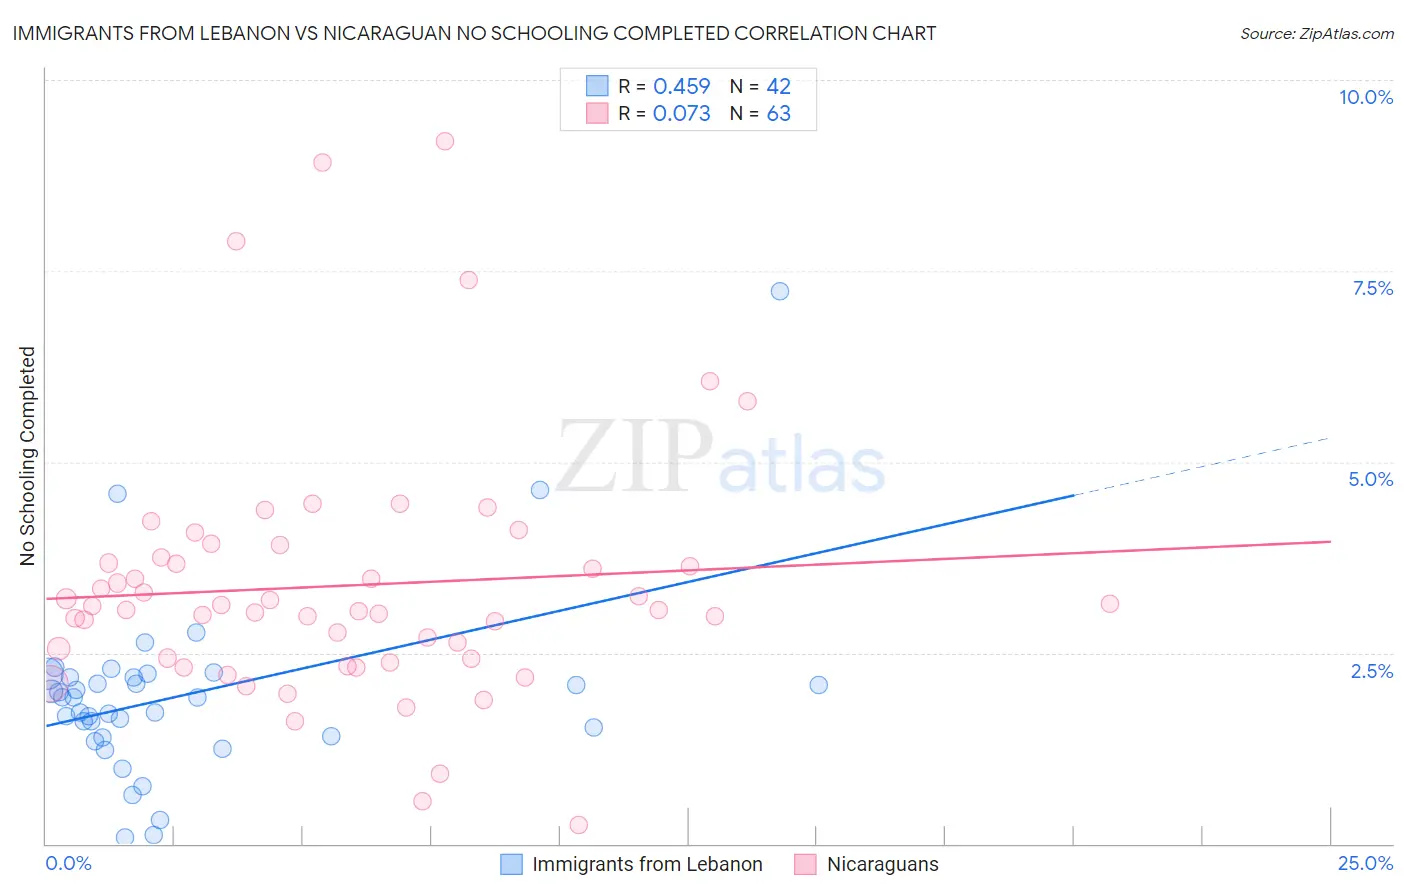
Immigrants from Lebanon vs Nicaraguan No Schooling Completed Correlation Chart
The statistical analysis conducted on geographies consisting of 216,259,293 people shows a moderate positive correlation between the proportion of Immigrants from Lebanon and percentage of population with no schooling in the United States with a correlation coefficient (R) of 0.459 and weighted average of 2.3%. Similarly, the statistical analysis conducted on geographies consisting of 284,425,297 people shows a slight positive correlation between the proportion of Nicaraguans and percentage of population with no schooling in the United States with a correlation coefficient (R) of 0.073 and weighted average of 2.9%, a difference of 27.6%.
No Schooling Completed Correlation Summary
| Measurement | Immigrants from Lebanon | Nicaraguan |
| Minimum | 0.079% | 0.24% |
| Maximum | 7.2% | 9.2% |
| Range | 7.2% | 9.0% |
| Mean | 2.0% | 3.4% |
| Median | 1.9% | 3.1% |
| Interquartile 25% (IQ1) | 1.4% | 2.4% |
| Interquartile 75% (IQ3) | 2.2% | 3.8% |
| Interquartile Range (IQR) | 0.77% | 1.3% |
| Standard Deviation (Sample) | 1.2% | 1.7% |
| Standard Deviation (Population) | 1.2% | 1.6% |
Similar Demographics by No Schooling Completed
Demographics Similar to Immigrants from Lebanon by No Schooling Completed
In terms of no schooling completed, the demographic groups most similar to Immigrants from Lebanon are Subsaharan African (2.3%, a difference of 0.15%), Tohono O'odham (2.3%, a difference of 0.29%), Sudanese (2.3%, a difference of 0.29%), Sierra Leonean (2.3%, a difference of 0.30%), and Immigrants from Sudan (2.3%, a difference of 0.33%).
| Demographics | Rating | Rank | No Schooling Completed |
| Tongans | 6.8 /100 | #216 | Tragic 2.3% |
| Immigrants | Syria | 6.6 /100 | #217 | Tragic 2.3% |
| Immigrants | Nepal | 6.4 /100 | #218 | Tragic 2.3% |
| Senegalese | 5.6 /100 | #219 | Tragic 2.3% |
| Immigrants | Costa Rica | 5.1 /100 | #220 | Tragic 2.3% |
| Immigrants | Sudan | 5.0 /100 | #221 | Tragic 2.3% |
| Sub-Saharan Africans | 4.7 /100 | #222 | Tragic 2.3% |
| Immigrants | Lebanon | 4.5 /100 | #223 | Tragic 2.3% |
| Tohono O'odham | 4.1 /100 | #224 | Tragic 2.3% |
| Sudanese | 4.1 /100 | #225 | Tragic 2.3% |
| Sierra Leoneans | 4.1 /100 | #226 | Tragic 2.3% |
| Immigrants | Uganda | 4.0 /100 | #227 | Tragic 2.3% |
| U.S. Virgin Islanders | 3.7 /100 | #228 | Tragic 2.3% |
| Immigrants | Pakistan | 3.6 /100 | #229 | Tragic 2.3% |
| Puerto Ricans | 3.4 /100 | #230 | Tragic 2.3% |
Demographics Similar to Nicaraguans by No Schooling Completed
In terms of no schooling completed, the demographic groups most similar to Nicaraguans are Somali (2.9%, a difference of 0.19%), Ecuadorian (3.0%, a difference of 0.47%), Immigrants from Caribbean (2.9%, a difference of 1.2%), Immigrants from South Eastern Asia (2.9%, a difference of 1.5%), and Belizean (3.0%, a difference of 2.1%).
| Demographics | Rating | Rank | No Schooling Completed |
| Immigrants | Cuba | 0.0 /100 | #297 | Tragic 2.8% |
| Immigrants | Dominica | 0.0 /100 | #298 | Tragic 2.8% |
| Central American Indians | 0.0 /100 | #299 | Tragic 2.8% |
| Haitians | 0.0 /100 | #300 | Tragic 2.9% |
| Immigrants | South Eastern Asia | 0.0 /100 | #301 | Tragic 2.9% |
| Immigrants | Caribbean | 0.0 /100 | #302 | Tragic 2.9% |
| Somalis | 0.0 /100 | #303 | Tragic 2.9% |
| Nicaraguans | 0.0 /100 | #304 | Tragic 2.9% |
| Ecuadorians | 0.0 /100 | #305 | Tragic 3.0% |
| Belizeans | 0.0 /100 | #306 | Tragic 3.0% |
| Immigrants | Haiti | 0.0 /100 | #307 | Tragic 3.0% |
| Immigrants | Somalia | 0.0 /100 | #308 | Tragic 3.0% |
| Hispanics or Latinos | 0.0 /100 | #309 | Tragic 3.0% |
| Guyanese | 0.0 /100 | #310 | Tragic 3.0% |
| Immigrants | Azores | 0.0 /100 | #311 | Tragic 3.0% |