Immigrants from Latvia vs Aleut Doctorate Degree
COMPARE
Immigrants from Latvia
Aleut
Doctorate Degree
Doctorate Degree Comparison
Immigrants from Latvia
Aleuts
2.4%
DOCTORATE DEGREE
100.0/ 100
METRIC RATING
53rd/ 347
METRIC RANK
1.5%
DOCTORATE DEGREE
0.4/ 100
METRIC RATING
275th/ 347
METRIC RANK
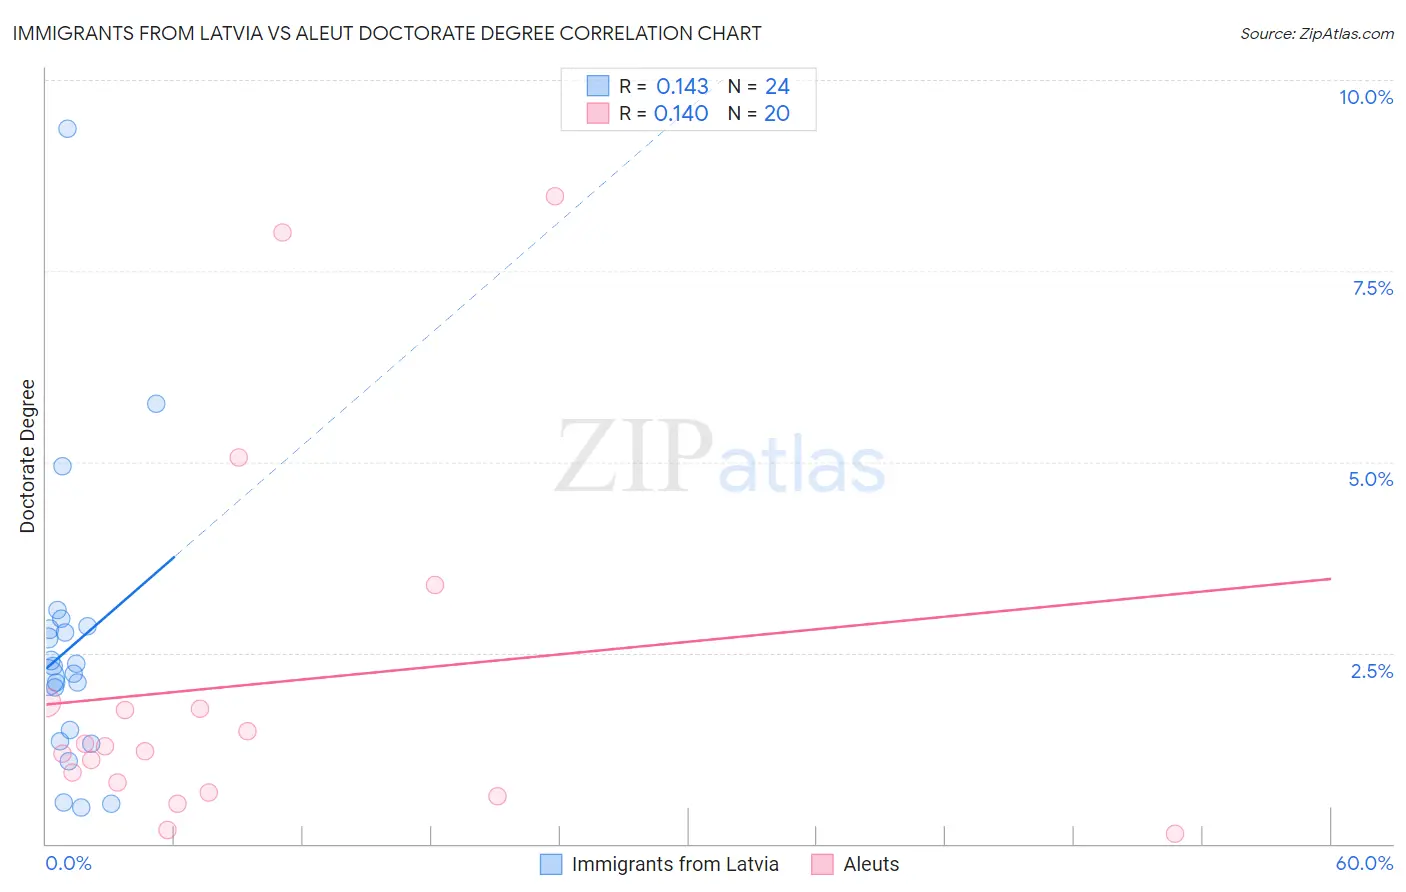
Immigrants from Latvia vs Aleut Doctorate Degree Correlation Chart
The statistical analysis conducted on geographies consisting of 113,595,553 people shows a poor positive correlation between the proportion of Immigrants from Latvia and percentage of population with at least doctorate degree education in the United States with a correlation coefficient (R) of 0.143 and weighted average of 2.4%. Similarly, the statistical analysis conducted on geographies consisting of 61,540,256 people shows a poor positive correlation between the proportion of Aleuts and percentage of population with at least doctorate degree education in the United States with a correlation coefficient (R) of 0.140 and weighted average of 1.5%, a difference of 62.0%.
Doctorate Degree Correlation Summary
| Measurement | Immigrants from Latvia | Aleut |
| Minimum | 0.48% | 0.13% |
| Maximum | 9.4% | 8.5% |
| Range | 8.9% | 8.3% |
| Mean | 2.6% | 2.1% |
| Median | 2.3% | 1.2% |
| Interquartile 25% (IQ1) | 1.4% | 0.74% |
| Interquartile 75% (IQ3) | 2.8% | 1.8% |
| Interquartile Range (IQR) | 1.4% | 1.1% |
| Standard Deviation (Sample) | 1.9% | 2.4% |
| Standard Deviation (Population) | 1.9% | 2.3% |
Similar Demographics by Doctorate Degree
Demographics Similar to Immigrants from Latvia by Doctorate Degree
In terms of doctorate degree, the demographic groups most similar to Immigrants from Latvia are Bulgarian (2.4%, a difference of 0.12%), Australian (2.4%, a difference of 0.59%), Immigrants from Norway (2.4%, a difference of 0.68%), Immigrants from Indonesia (2.4%, a difference of 0.68%), and Bolivian (2.4%, a difference of 0.76%).
| Demographics | Rating | Rank | Doctorate Degree |
| Immigrants | Austria | 100.0 /100 | #46 | Exceptional 2.4% |
| Immigrants | Western Europe | 100.0 /100 | #47 | Exceptional 2.4% |
| Asians | 100.0 /100 | #48 | Exceptional 2.4% |
| Immigrants | Asia | 100.0 /100 | #49 | Exceptional 2.4% |
| Immigrants | Norway | 100.0 /100 | #50 | Exceptional 2.4% |
| Australians | 100.0 /100 | #51 | Exceptional 2.4% |
| Bulgarians | 100.0 /100 | #52 | Exceptional 2.4% |
| Immigrants | Latvia | 100.0 /100 | #53 | Exceptional 2.4% |
| Immigrants | Indonesia | 100.0 /100 | #54 | Exceptional 2.4% |
| Bolivians | 100.0 /100 | #55 | Exceptional 2.4% |
| Immigrants | Czechoslovakia | 100.0 /100 | #56 | Exceptional 2.4% |
| Immigrants | Ethiopia | 100.0 /100 | #57 | Exceptional 2.4% |
| Ethiopians | 99.9 /100 | #58 | Exceptional 2.3% |
| South Africans | 99.9 /100 | #59 | Exceptional 2.3% |
| Immigrants | Serbia | 99.9 /100 | #60 | Exceptional 2.3% |
Demographics Similar to Aleuts by Doctorate Degree
In terms of doctorate degree, the demographic groups most similar to Aleuts are Paiute (1.5%, a difference of 0.050%), Yaqui (1.5%, a difference of 0.12%), Sioux (1.5%, a difference of 0.14%), Immigrants from Barbados (1.5%, a difference of 0.25%), and Immigrants from Trinidad and Tobago (1.5%, a difference of 0.34%).
| Demographics | Rating | Rank | Doctorate Degree |
| U.S. Virgin Islanders | 0.5 /100 | #268 | Tragic 1.5% |
| Crow | 0.5 /100 | #269 | Tragic 1.5% |
| Salvadorans | 0.5 /100 | #270 | Tragic 1.5% |
| Immigrants | Trinidad and Tobago | 0.5 /100 | #271 | Tragic 1.5% |
| Immigrants | Barbados | 0.4 /100 | #272 | Tragic 1.5% |
| Sioux | 0.4 /100 | #273 | Tragic 1.5% |
| Yaqui | 0.4 /100 | #274 | Tragic 1.5% |
| Aleuts | 0.4 /100 | #275 | Tragic 1.5% |
| Paiute | 0.4 /100 | #276 | Tragic 1.5% |
| Bahamians | 0.4 /100 | #277 | Tragic 1.5% |
| Hawaiians | 0.4 /100 | #278 | Tragic 1.5% |
| Marshallese | 0.4 /100 | #279 | Tragic 1.5% |
| Ecuadorians | 0.4 /100 | #280 | Tragic 1.5% |
| Tohono O'odham | 0.4 /100 | #281 | Tragic 1.5% |
| British West Indians | 0.3 /100 | #282 | Tragic 1.5% |