Northern European vs Slovene High School Diploma
COMPARE
Northern European
Slovene
High School Diploma
High School Diploma Comparison
Northern Europeans
Slovenes
91.3%
HIGH SCHOOL DIPLOMA
99.8/ 100
METRIC RATING
42nd/ 347
METRIC RANK
92.0%
HIGH SCHOOL DIPLOMA
100.0/ 100
METRIC RATING
5th/ 347
METRIC RANK
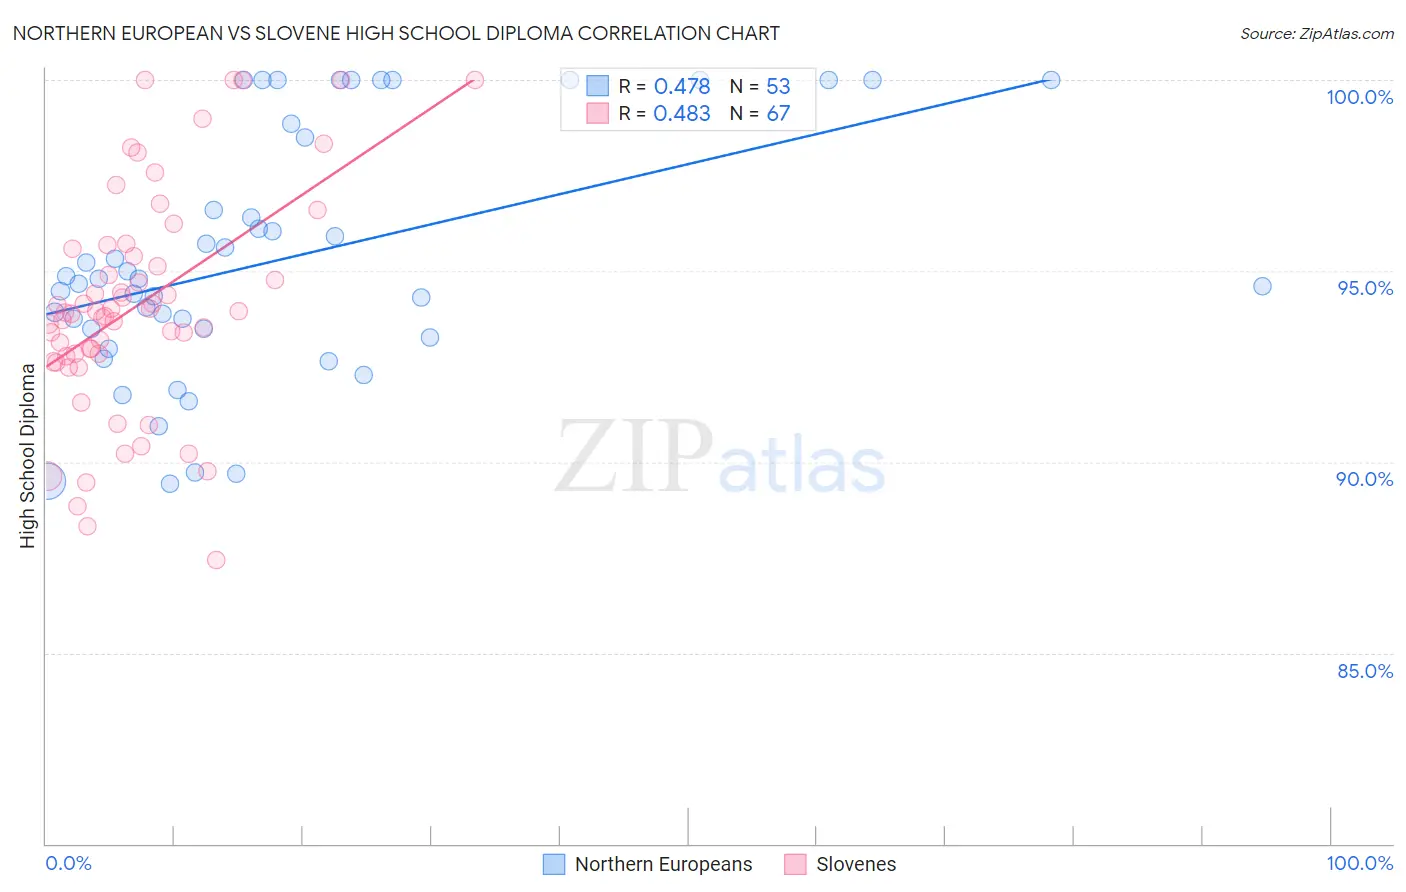
Northern European vs Slovene High School Diploma Correlation Chart
The statistical analysis conducted on geographies consisting of 406,096,351 people shows a moderate positive correlation between the proportion of Northern Europeans and percentage of population with at least high school diploma education in the United States with a correlation coefficient (R) of 0.478 and weighted average of 91.3%. Similarly, the statistical analysis conducted on geographies consisting of 261,353,550 people shows a moderate positive correlation between the proportion of Slovenes and percentage of population with at least high school diploma education in the United States with a correlation coefficient (R) of 0.483 and weighted average of 92.0%, a difference of 0.85%.
High School Diploma Correlation Summary
| Measurement | Northern European | Slovene |
| Minimum | 89.4% | 87.4% |
| Maximum | 100.0% | 100.0% |
| Range | 10.6% | 12.6% |
| Mean | 95.3% | 94.1% |
| Median | 94.8% | 93.9% |
| Interquartile 25% (IQ1) | 93.4% | 92.8% |
| Interquartile 75% (IQ3) | 98.7% | 95.6% |
| Interquartile Range (IQR) | 5.3% | 2.8% |
| Standard Deviation (Sample) | 3.2% | 2.9% |
| Standard Deviation (Population) | 3.2% | 2.9% |
Similar Demographics by High School Diploma
Demographics Similar to Northern Europeans by High School Diploma
In terms of high school diploma, the demographic groups most similar to Northern Europeans are Immigrants from Australia (91.3%, a difference of 0.010%), British (91.3%, a difference of 0.010%), Immigrants from Austria (91.3%, a difference of 0.020%), Turkish (91.2%, a difference of 0.020%), and Immigrants from Lithuania (91.3%, a difference of 0.030%).
| Demographics | Rating | Rank | High School Diploma |
| Irish | 99.9 /100 | #35 | Exceptional 91.4% |
| Tsimshian | 99.9 /100 | #36 | Exceptional 91.3% |
| Immigrants | Ireland | 99.9 /100 | #37 | Exceptional 91.3% |
| Immigrants | Scotland | 99.8 /100 | #38 | Exceptional 91.3% |
| Dutch | 99.8 /100 | #39 | Exceptional 91.3% |
| Immigrants | Lithuania | 99.8 /100 | #40 | Exceptional 91.3% |
| Immigrants | Australia | 99.8 /100 | #41 | Exceptional 91.3% |
| Northern Europeans | 99.8 /100 | #42 | Exceptional 91.3% |
| British | 99.8 /100 | #43 | Exceptional 91.3% |
| Immigrants | Austria | 99.8 /100 | #44 | Exceptional 91.3% |
| Turks | 99.8 /100 | #45 | Exceptional 91.2% |
| Greeks | 99.8 /100 | #46 | Exceptional 91.2% |
| Australians | 99.8 /100 | #47 | Exceptional 91.2% |
| Belgians | 99.8 /100 | #48 | Exceptional 91.2% |
| Bhutanese | 99.8 /100 | #49 | Exceptional 91.2% |
Demographics Similar to Slovenes by High School Diploma
In terms of high school diploma, the demographic groups most similar to Slovenes are Lithuanian (92.0%, a difference of 0.0%), Slovak (92.0%, a difference of 0.020%), Immigrants from India (92.0%, a difference of 0.020%), Chinese (92.0%, a difference of 0.040%), and Latvian (92.0%, a difference of 0.050%).
| Demographics | Rating | Rank | High School Diploma |
| Norwegians | 100.0 /100 | #1 | Exceptional 92.5% |
| Swedes | 100.0 /100 | #2 | Exceptional 92.2% |
| Carpatho Rusyns | 100.0 /100 | #3 | Exceptional 92.1% |
| Lithuanians | 100.0 /100 | #4 | Exceptional 92.0% |
| Slovenes | 100.0 /100 | #5 | Exceptional 92.0% |
| Slovaks | 100.0 /100 | #6 | Exceptional 92.0% |
| Immigrants | India | 100.0 /100 | #7 | Exceptional 92.0% |
| Chinese | 100.0 /100 | #8 | Exceptional 92.0% |
| Latvians | 100.0 /100 | #9 | Exceptional 92.0% |
| Croatians | 100.0 /100 | #10 | Exceptional 92.0% |
| Eastern Europeans | 100.0 /100 | #11 | Exceptional 91.9% |
| Poles | 100.0 /100 | #12 | Exceptional 91.9% |
| Danes | 100.0 /100 | #13 | Exceptional 91.8% |
| Bulgarians | 100.0 /100 | #14 | Exceptional 91.8% |
| Luxembourgers | 100.0 /100 | #15 | Exceptional 91.7% |