Native Hawaiian vs Immigrants No Schooling Completed
COMPARE
Native Hawaiian
Immigrants
No Schooling Completed
No Schooling Completed Comparison
Native Hawaiians
Immigrants
1.6%
NO SCHOOLING COMPLETED
99.9/ 100
METRIC RATING
39th/ 347
METRIC RANK
2.8%
NO SCHOOLING COMPLETED
0.0/ 100
METRIC RATING
296th/ 347
METRIC RANK
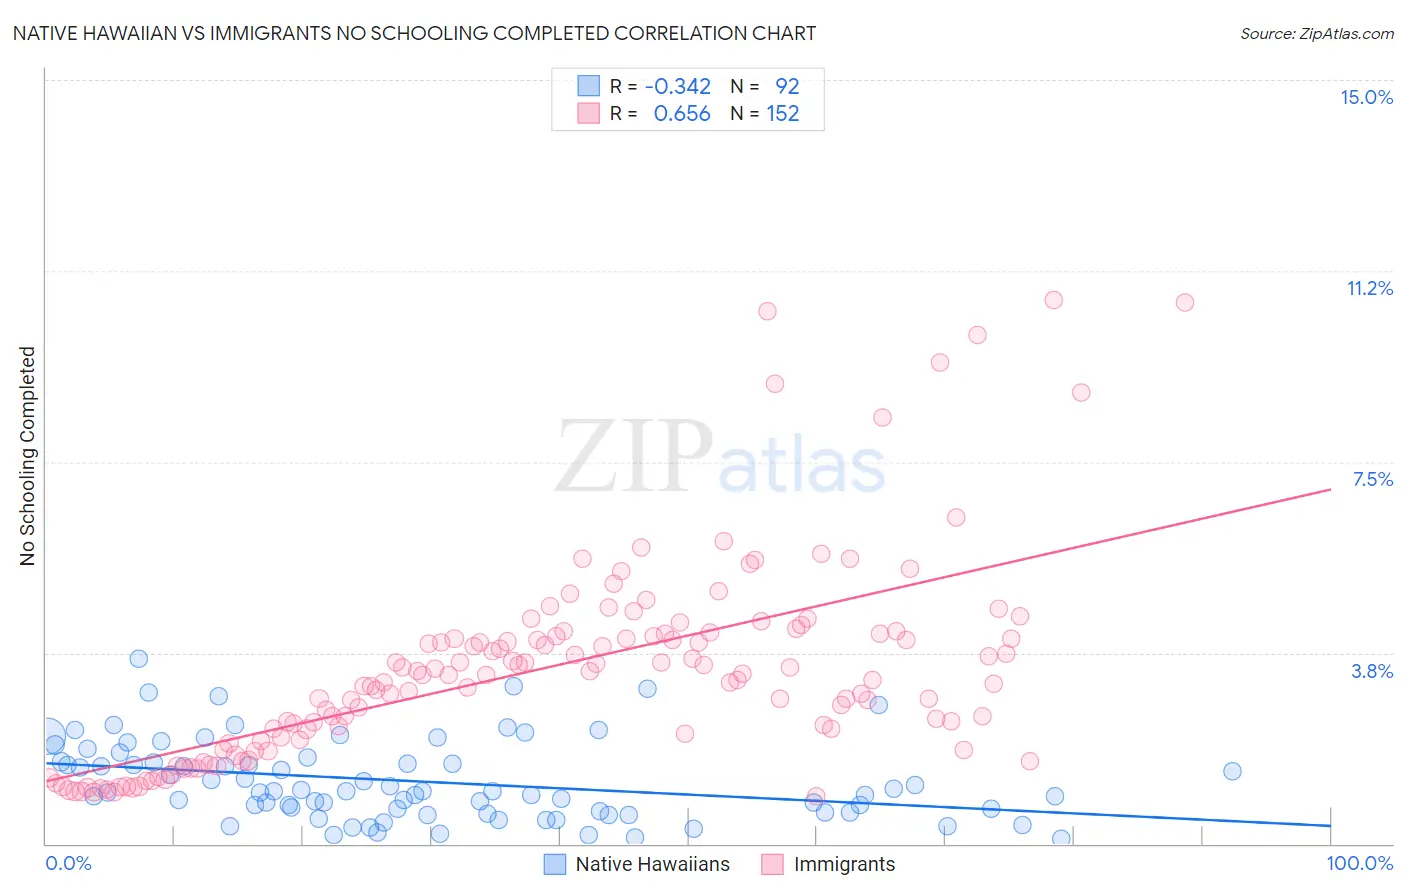
Native Hawaiian vs Immigrants No Schooling Completed Correlation Chart
The statistical analysis conducted on geographies consisting of 328,857,957 people shows a mild negative correlation between the proportion of Native Hawaiians and percentage of population with no schooling in the United States with a correlation coefficient (R) of -0.342 and weighted average of 1.6%. Similarly, the statistical analysis conducted on geographies consisting of 558,837,103 people shows a significant positive correlation between the proportion of Immigrants and percentage of population with no schooling in the United States with a correlation coefficient (R) of 0.656 and weighted average of 2.8%, a difference of 76.2%.
No Schooling Completed Correlation Summary
| Measurement | Native Hawaiian | Immigrants |
| Minimum | 0.093% | 0.93% |
| Maximum | 3.6% | 10.7% |
| Range | 3.5% | 9.8% |
| Mean | 1.2% | 3.4% |
| Median | 1.0% | 3.3% |
| Interquartile 25% (IQ1) | 0.63% | 2.0% |
| Interquartile 75% (IQ3) | 1.6% | 4.1% |
| Interquartile Range (IQR) | 0.97% | 2.1% |
| Standard Deviation (Sample) | 0.78% | 2.0% |
| Standard Deviation (Population) | 0.77% | 2.0% |
Similar Demographics by No Schooling Completed
Demographics Similar to Native Hawaiians by No Schooling Completed
In terms of no schooling completed, the demographic groups most similar to Native Hawaiians are Northern European (1.6%, a difference of 0.27%), Luxembourger (1.6%, a difference of 0.35%), Belgian (1.6%, a difference of 0.40%), Hungarian (1.6%, a difference of 0.62%), and Aleut (1.6%, a difference of 0.67%).
| Demographics | Rating | Rank | No Schooling Completed |
| Swiss | 100.0 /100 | #32 | Exceptional 1.5% |
| Italians | 100.0 /100 | #33 | Exceptional 1.5% |
| Latvians | 100.0 /100 | #34 | Exceptional 1.5% |
| Eastern Europeans | 100.0 /100 | #35 | Exceptional 1.6% |
| Aleuts | 99.9 /100 | #36 | Exceptional 1.6% |
| Belgians | 99.9 /100 | #37 | Exceptional 1.6% |
| Northern Europeans | 99.9 /100 | #38 | Exceptional 1.6% |
| Native Hawaiians | 99.9 /100 | #39 | Exceptional 1.6% |
| Luxembourgers | 99.9 /100 | #40 | Exceptional 1.6% |
| Hungarians | 99.9 /100 | #41 | Exceptional 1.6% |
| Bulgarians | 99.9 /100 | #42 | Exceptional 1.6% |
| Australians | 99.9 /100 | #43 | Exceptional 1.6% |
| Estonians | 99.9 /100 | #44 | Exceptional 1.6% |
| Czechoslovakians | 99.9 /100 | #45 | Exceptional 1.6% |
| Maltese | 99.9 /100 | #46 | Exceptional 1.6% |
Demographics Similar to Immigrants by No Schooling Completed
In terms of no schooling completed, the demographic groups most similar to Immigrants are Houma (2.8%, a difference of 0.10%), Immigrants from Eritrea (2.8%, a difference of 0.62%), Malaysian (2.8%, a difference of 0.79%), Immigrants from Cuba (2.8%, a difference of 1.1%), and Immigrants from Grenada (2.8%, a difference of 1.2%).
| Demographics | Rating | Rank | No Schooling Completed |
| Immigrants | Thailand | 0.0 /100 | #289 | Tragic 2.7% |
| Immigrants | Hong Kong | 0.0 /100 | #290 | Tragic 2.7% |
| British West Indians | 0.0 /100 | #291 | Tragic 2.7% |
| Immigrants | Grenada | 0.0 /100 | #292 | Tragic 2.8% |
| Malaysians | 0.0 /100 | #293 | Tragic 2.8% |
| Immigrants | Eritrea | 0.0 /100 | #294 | Tragic 2.8% |
| Houma | 0.0 /100 | #295 | Tragic 2.8% |
| Immigrants | Immigrants | 0.0 /100 | #296 | Tragic 2.8% |
| Immigrants | Cuba | 0.0 /100 | #297 | Tragic 2.8% |
| Immigrants | Dominica | 0.0 /100 | #298 | Tragic 2.8% |
| Central American Indians | 0.0 /100 | #299 | Tragic 2.8% |
| Haitians | 0.0 /100 | #300 | Tragic 2.9% |
| Immigrants | South Eastern Asia | 0.0 /100 | #301 | Tragic 2.9% |
| Immigrants | Caribbean | 0.0 /100 | #302 | Tragic 2.9% |
| Somalis | 0.0 /100 | #303 | Tragic 2.9% |