Immigrants from Egypt vs Palestinian 9th Grade
COMPARE
Immigrants from Egypt
Palestinian
9th Grade
9th Grade Comparison
Immigrants from Egypt
Palestinians
94.9%
9TH GRADE
50.0/ 100
METRIC RATING
174th/ 347
METRIC RANK
95.4%
9TH GRADE
94.3/ 100
METRIC RATING
127th/ 347
METRIC RANK
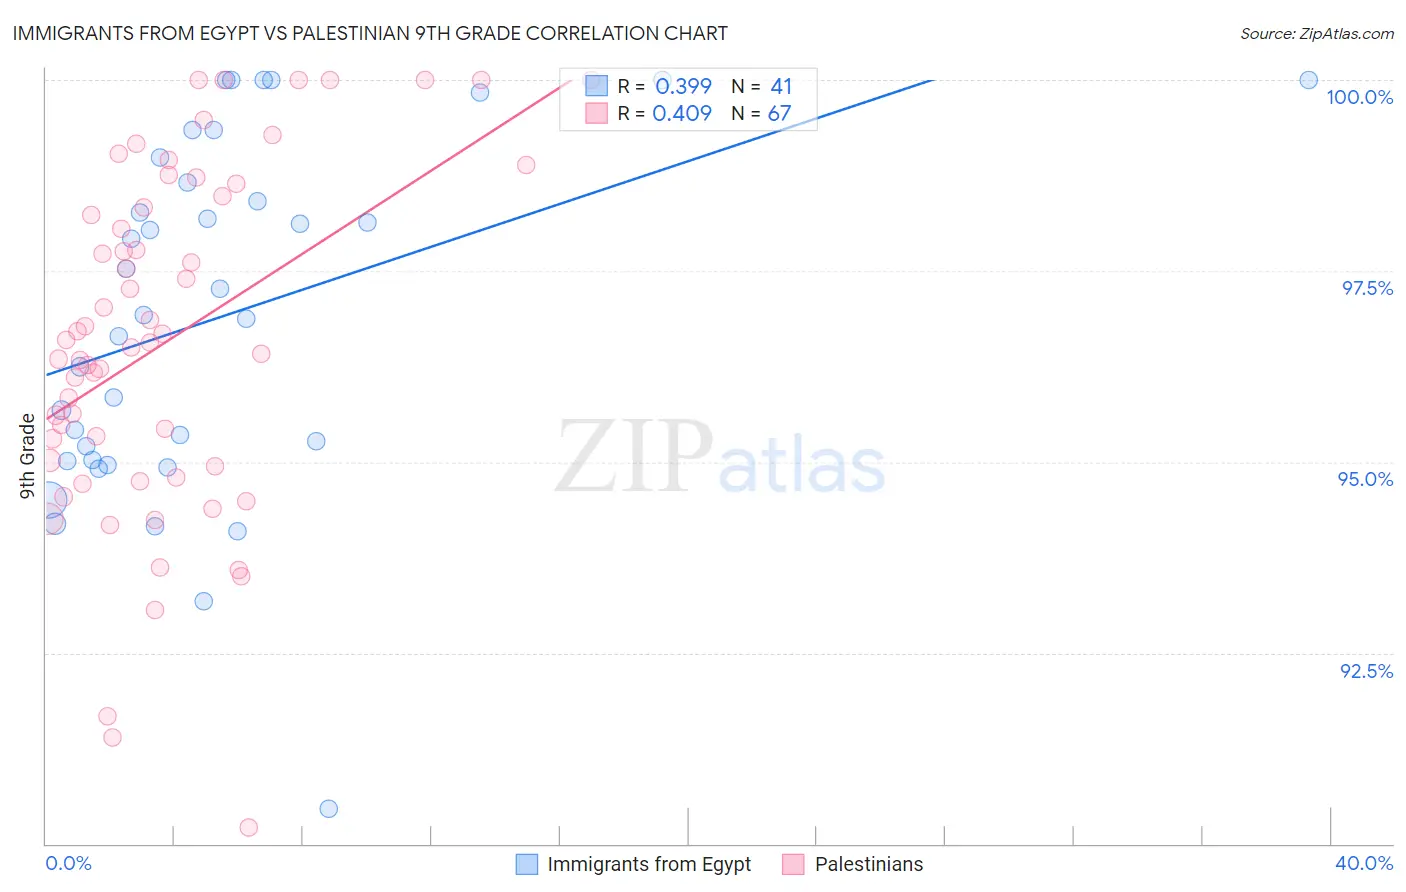
Immigrants from Egypt vs Palestinian 9th Grade Correlation Chart
The statistical analysis conducted on geographies consisting of 245,485,794 people shows a mild positive correlation between the proportion of Immigrants from Egypt and percentage of population with at least 9th grade education in the United States with a correlation coefficient (R) of 0.399 and weighted average of 94.9%. Similarly, the statistical analysis conducted on geographies consisting of 216,424,519 people shows a moderate positive correlation between the proportion of Palestinians and percentage of population with at least 9th grade education in the United States with a correlation coefficient (R) of 0.409 and weighted average of 95.4%, a difference of 0.51%.
9th Grade Correlation Summary
| Measurement | Immigrants from Egypt | Palestinian |
| Minimum | 90.5% | 90.2% |
| Maximum | 100.0% | 100.0% |
| Range | 9.5% | 9.8% |
| Mean | 96.9% | 96.6% |
| Median | 96.9% | 96.6% |
| Interquartile 25% (IQ1) | 95.0% | 94.9% |
| Interquartile 75% (IQ3) | 98.8% | 98.5% |
| Interquartile Range (IQR) | 3.8% | 3.5% |
| Standard Deviation (Sample) | 2.3% | 2.3% |
| Standard Deviation (Population) | 2.3% | 2.3% |
Similar Demographics by 9th Grade
Demographics Similar to Immigrants from Egypt by 9th Grade
In terms of 9th grade, the demographic groups most similar to Immigrants from Egypt are Brazilian (94.9%, a difference of 0.0%), Cheyenne (94.9%, a difference of 0.010%), Immigrants from Spain (94.9%, a difference of 0.010%), Immigrants from Iraq (94.9%, a difference of 0.020%), and Immigrants from Poland (94.9%, a difference of 0.020%).
| Demographics | Rating | Rank | 9th Grade |
| Immigrants | Brazil | 61.1 /100 | #167 | Good 95.0% |
| Chileans | 60.7 /100 | #168 | Good 95.0% |
| Spaniards | 59.6 /100 | #169 | Average 94.9% |
| Alsatians | 58.6 /100 | #170 | Average 94.9% |
| Colville | 58.5 /100 | #171 | Average 94.9% |
| Iraqis | 54.0 /100 | #172 | Average 94.9% |
| Cheyenne | 51.5 /100 | #173 | Average 94.9% |
| Immigrants | Egypt | 50.0 /100 | #174 | Average 94.9% |
| Brazilians | 49.8 /100 | #175 | Average 94.9% |
| Immigrants | Spain | 49.1 /100 | #176 | Average 94.9% |
| Immigrants | Iraq | 47.8 /100 | #177 | Average 94.9% |
| Immigrants | Poland | 46.7 /100 | #178 | Average 94.9% |
| Immigrants | Venezuela | 46.5 /100 | #179 | Average 94.9% |
| Immigrants | Uganda | 43.1 /100 | #180 | Average 94.8% |
| Sierra Leoneans | 42.7 /100 | #181 | Average 94.8% |
Demographics Similar to Palestinians by 9th Grade
In terms of 9th grade, the demographic groups most similar to Palestinians are Immigrants from Serbia (95.4%, a difference of 0.0%), Immigrants from Hungary (95.4%, a difference of 0.0%), Basque (95.4%, a difference of 0.010%), Jordanian (95.3%, a difference of 0.020%), and Immigrants from South Central Asia (95.4%, a difference of 0.030%).
| Demographics | Rating | Rank | 9th Grade |
| Cambodians | 95.6 /100 | #120 | Exceptional 95.4% |
| Cree | 95.5 /100 | #121 | Exceptional 95.4% |
| Immigrants | Kuwait | 95.5 /100 | #122 | Exceptional 95.4% |
| Kiowa | 95.3 /100 | #123 | Exceptional 95.4% |
| Shoshone | 95.3 /100 | #124 | Exceptional 95.4% |
| Immigrants | South Central Asia | 95.1 /100 | #125 | Exceptional 95.4% |
| Immigrants | Serbia | 94.4 /100 | #126 | Exceptional 95.4% |
| Palestinians | 94.3 /100 | #127 | Exceptional 95.4% |
| Immigrants | Hungary | 94.2 /100 | #128 | Exceptional 95.4% |
| Basques | 94.1 /100 | #129 | Exceptional 95.4% |
| Jordanians | 93.5 /100 | #130 | Exceptional 95.3% |
| Immigrants | North Macedonia | 92.3 /100 | #131 | Exceptional 95.3% |
| Immigrants | Nonimmigrants | 92.0 /100 | #132 | Exceptional 95.3% |
| Israelis | 90.4 /100 | #133 | Exceptional 95.3% |
| Immigrants | Israel | 89.6 /100 | #134 | Excellent 95.3% |