Immigrants from Kazakhstan vs Mexican Professional Degree
COMPARE
Immigrants from Kazakhstan
Mexican
Professional Degree
Professional Degree Comparison
Immigrants from Kazakhstan
Mexicans
5.5%
PROFESSIONAL DEGREE
99.9/ 100
METRIC RATING
66th/ 347
METRIC RANK
2.7%
PROFESSIONAL DEGREE
0.0/ 100
METRIC RATING
343rd/ 347
METRIC RANK
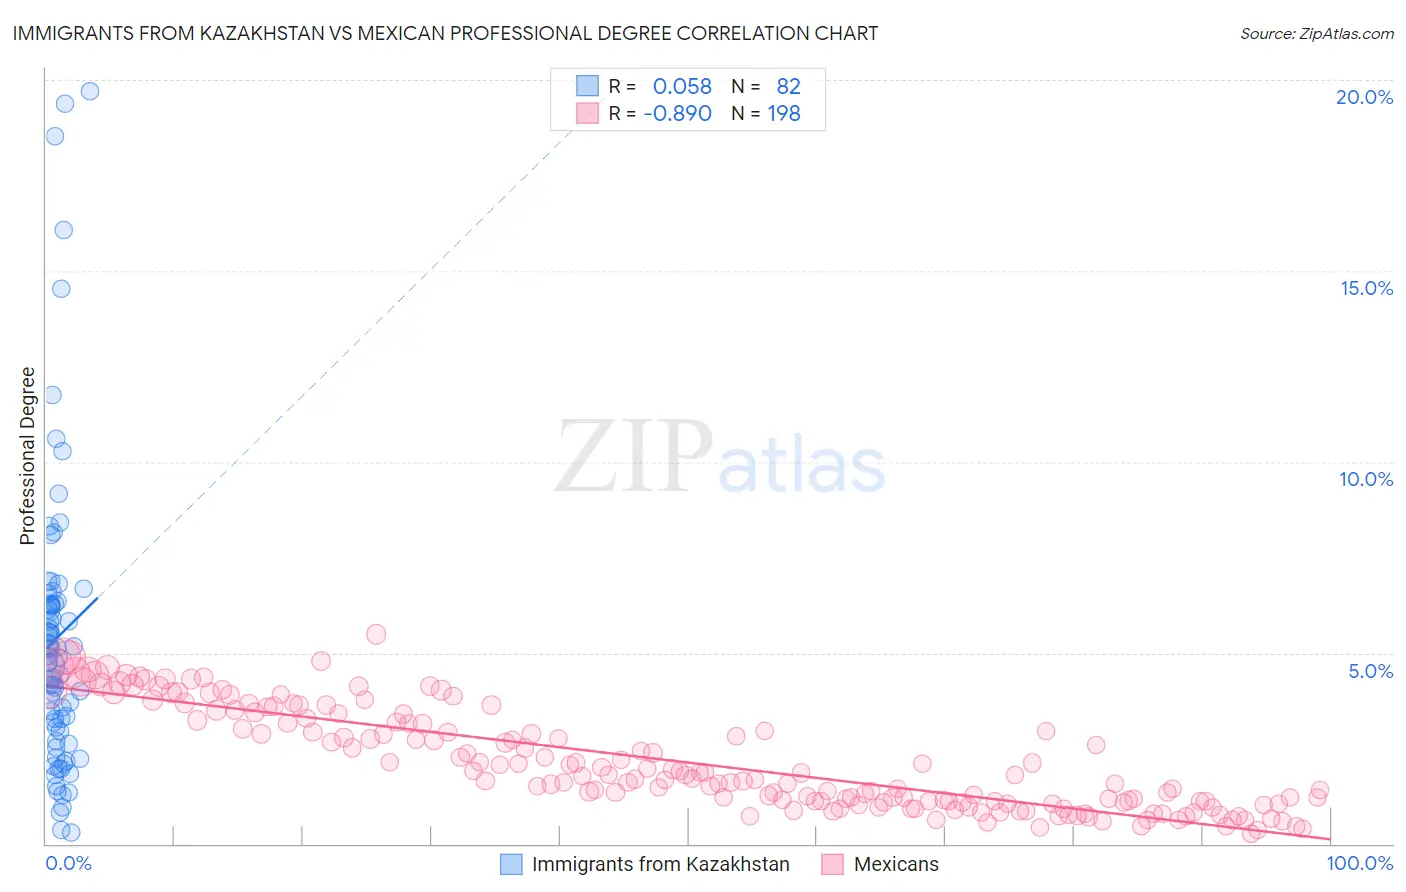
Immigrants from Kazakhstan vs Mexican Professional Degree Correlation Chart
The statistical analysis conducted on geographies consisting of 124,400,013 people shows a slight positive correlation between the proportion of Immigrants from Kazakhstan and percentage of population with at least professional degree education in the United States with a correlation coefficient (R) of 0.058 and weighted average of 5.5%. Similarly, the statistical analysis conducted on geographies consisting of 557,026,409 people shows a very strong negative correlation between the proportion of Mexicans and percentage of population with at least professional degree education in the United States with a correlation coefficient (R) of -0.890 and weighted average of 2.7%, a difference of 99.7%.
Professional Degree Correlation Summary
| Measurement | Immigrants from Kazakhstan | Mexican |
| Minimum | 0.30% | 0.25% |
| Maximum | 19.7% | 5.5% |
| Range | 19.4% | 5.2% |
| Mean | 5.4% | 2.1% |
| Median | 4.8% | 1.7% |
| Interquartile 25% (IQ1) | 2.9% | 1.1% |
| Interquartile 75% (IQ3) | 6.3% | 3.2% |
| Interquartile Range (IQR) | 3.4% | 2.1% |
| Standard Deviation (Sample) | 3.9% | 1.3% |
| Standard Deviation (Population) | 3.9% | 1.3% |
Similar Demographics by Professional Degree
Demographics Similar to Immigrants from Kazakhstan by Professional Degree
In terms of professional degree, the demographic groups most similar to Immigrants from Kazakhstan are Immigrants from Bolivia (5.5%, a difference of 0.24%), Immigrants from Asia (5.5%, a difference of 0.30%), Immigrants from Bulgaria (5.5%, a difference of 0.32%), Asian (5.5%, a difference of 0.36%), and Immigrants from Lebanon (5.5%, a difference of 0.51%).
| Demographics | Rating | Rank | Professional Degree |
| Immigrants | Europe | 100.0 /100 | #59 | Exceptional 5.6% |
| Bolivians | 99.9 /100 | #60 | Exceptional 5.6% |
| Immigrants | Lithuania | 99.9 /100 | #61 | Exceptional 5.6% |
| Immigrants | Belarus | 99.9 /100 | #62 | Exceptional 5.5% |
| Asians | 99.9 /100 | #63 | Exceptional 5.5% |
| Immigrants | Asia | 99.9 /100 | #64 | Exceptional 5.5% |
| Immigrants | Bolivia | 99.9 /100 | #65 | Exceptional 5.5% |
| Immigrants | Kazakhstan | 99.9 /100 | #66 | Exceptional 5.5% |
| Immigrants | Bulgaria | 99.9 /100 | #67 | Exceptional 5.5% |
| Immigrants | Lebanon | 99.9 /100 | #68 | Exceptional 5.5% |
| Immigrants | Hungary | 99.9 /100 | #69 | Exceptional 5.5% |
| Bhutanese | 99.8 /100 | #70 | Exceptional 5.4% |
| Immigrants | Western Asia | 99.8 /100 | #71 | Exceptional 5.4% |
| Lithuanians | 99.8 /100 | #72 | Exceptional 5.4% |
| Immigrants | Romania | 99.8 /100 | #73 | Exceptional 5.4% |
Demographics Similar to Mexicans by Professional Degree
In terms of professional degree, the demographic groups most similar to Mexicans are Immigrants from the Azores (2.8%, a difference of 2.8%), Tohono O'odham (2.8%, a difference of 3.5%), Spanish American Indian (2.7%, a difference of 3.6%), Immigrants from Mexico (2.6%, a difference of 4.0%), and Yup'ik (2.9%, a difference of 4.3%).
| Demographics | Rating | Rank | Professional Degree |
| Puget Sound Salish | 0.0 /100 | #333 | Tragic 3.1% |
| Pennsylvania Germans | 0.0 /100 | #334 | Tragic 3.0% |
| Natives/Alaskans | 0.0 /100 | #335 | Tragic 3.0% |
| Fijians | 0.0 /100 | #336 | Tragic 2.9% |
| Arapaho | 0.0 /100 | #337 | Tragic 2.9% |
| Navajo | 0.0 /100 | #338 | Tragic 2.9% |
| Immigrants | Central America | 0.0 /100 | #339 | Tragic 2.9% |
| Yup'ik | 0.0 /100 | #340 | Tragic 2.9% |
| Tohono O'odham | 0.0 /100 | #341 | Tragic 2.8% |
| Immigrants | Azores | 0.0 /100 | #342 | Tragic 2.8% |
| Mexicans | 0.0 /100 | #343 | Tragic 2.7% |
| Spanish American Indians | 0.0 /100 | #344 | Tragic 2.7% |
| Immigrants | Mexico | 0.0 /100 | #345 | Tragic 2.6% |
| Lumbee | 0.0 /100 | #346 | Tragic 2.5% |
| Houma | 0.0 /100 | #347 | Tragic 2.2% |