Immigrants from Laos vs Irish 1st Grade
COMPARE
Immigrants from Laos
Irish
1st Grade
1st Grade Comparison
Immigrants from Laos
Irish
96.8%
1ST GRADE
0.0/ 100
METRIC RATING
318th/ 347
METRIC RANK
98.6%
1ST GRADE
100.0/ 100
METRIC RATING
19th/ 347
METRIC RANK
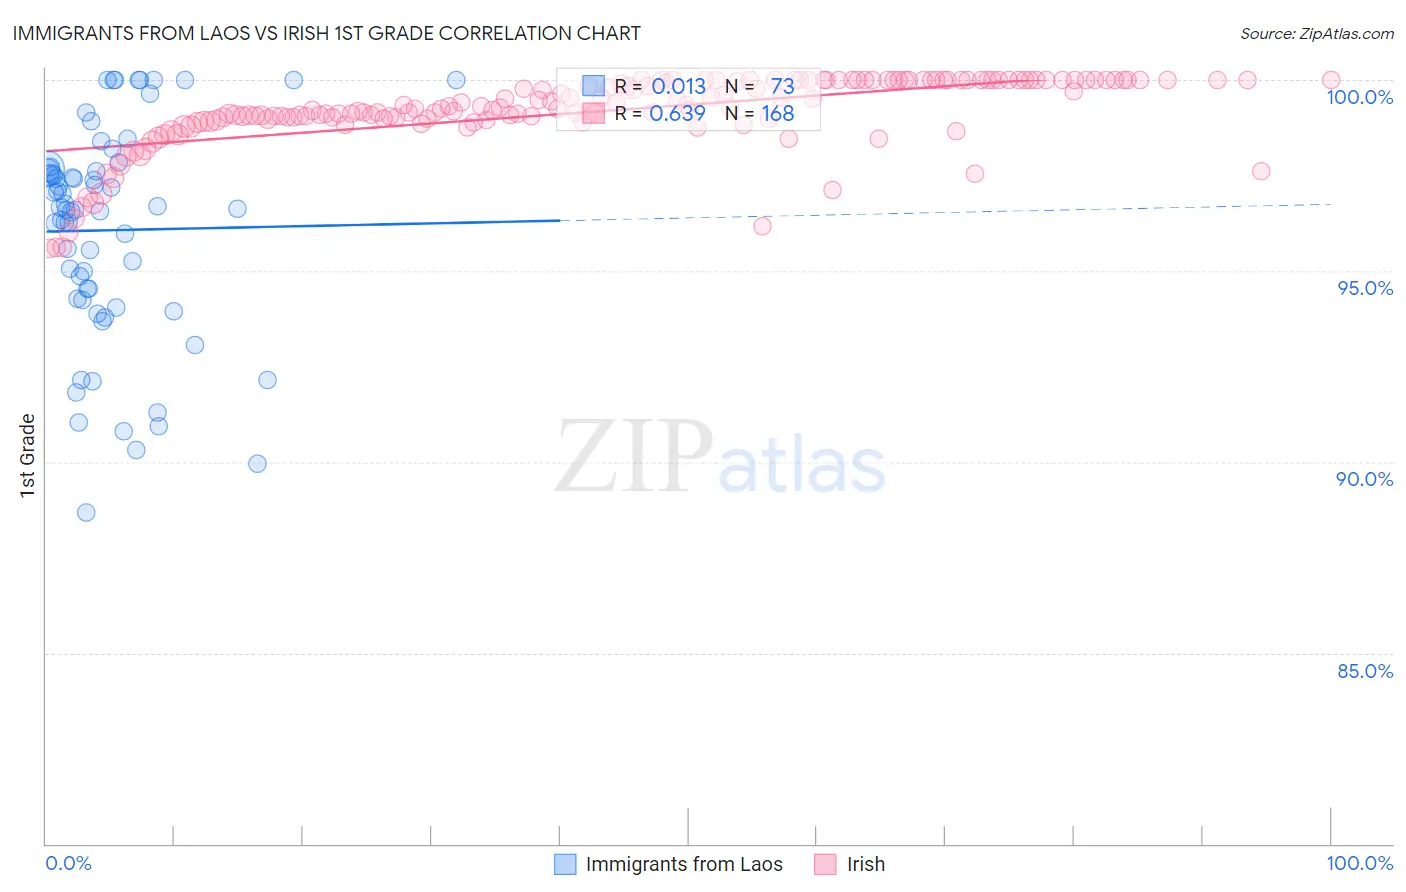
Immigrants from Laos vs Irish 1st Grade Correlation Chart
The statistical analysis conducted on geographies consisting of 201,453,273 people shows no correlation between the proportion of Immigrants from Laos and percentage of population with at least 1st grade education in the United States with a correlation coefficient (R) of 0.013 and weighted average of 96.8%. Similarly, the statistical analysis conducted on geographies consisting of 580,708,963 people shows a significant positive correlation between the proportion of Irish and percentage of population with at least 1st grade education in the United States with a correlation coefficient (R) of 0.639 and weighted average of 98.6%, a difference of 1.8%.
1st Grade Correlation Summary
| Measurement | Immigrants from Laos | Irish |
| Minimum | 88.7% | 95.6% |
| Maximum | 100.0% | 100.0% |
| Range | 11.3% | 4.4% |
| Mean | 96.1% | 99.2% |
| Median | 96.6% | 99.3% |
| Interquartile 25% (IQ1) | 94.3% | 99.0% |
| Interquartile 75% (IQ3) | 97.6% | 100.0% |
| Interquartile Range (IQR) | 3.4% | 1.0% |
| Standard Deviation (Sample) | 2.8% | 0.97% |
| Standard Deviation (Population) | 2.8% | 0.96% |
Similar Demographics by 1st Grade
Demographics Similar to Immigrants from Laos by 1st Grade
In terms of 1st grade, the demographic groups most similar to Immigrants from Laos are Immigrants from Guyana (96.8%, a difference of 0.010%), Immigrants from Burma/Myanmar (96.8%, a difference of 0.020%), Immigrants from Bangladesh (96.8%, a difference of 0.020%), Mexican American Indian (96.8%, a difference of 0.040%), and Immigrants from Ecuador (96.9%, a difference of 0.050%).
| Demographics | Rating | Rank | 1st Grade |
| Sri Lankans | 0.0 /100 | #311 | Tragic 96.9% |
| Cape Verdeans | 0.0 /100 | #312 | Tragic 96.9% |
| Guyanese | 0.0 /100 | #313 | Tragic 96.9% |
| Hondurans | 0.0 /100 | #314 | Tragic 96.9% |
| Immigrants | Belize | 0.0 /100 | #315 | Tragic 96.9% |
| Immigrants | Ecuador | 0.0 /100 | #316 | Tragic 96.9% |
| Immigrants | Nicaragua | 0.0 /100 | #317 | Tragic 96.9% |
| Immigrants | Laos | 0.0 /100 | #318 | Tragic 96.8% |
| Immigrants | Guyana | 0.0 /100 | #319 | Tragic 96.8% |
| Immigrants | Burma/Myanmar | 0.0 /100 | #320 | Tragic 96.8% |
| Immigrants | Bangladesh | 0.0 /100 | #321 | Tragic 96.8% |
| Mexican American Indians | 0.0 /100 | #322 | Tragic 96.8% |
| Immigrants | Honduras | 0.0 /100 | #323 | Tragic 96.8% |
| Vietnamese | 0.0 /100 | #324 | Tragic 96.8% |
| Dominicans | 0.0 /100 | #325 | Tragic 96.7% |
Demographics Similar to Irish by 1st Grade
In terms of 1st grade, the demographic groups most similar to Irish are Sioux (98.6%, a difference of 0.010%), Arapaho (98.6%, a difference of 0.010%), Pennsylvania German (98.6%, a difference of 0.010%), Finnish (98.6%, a difference of 0.010%), and Lithuanian (98.6%, a difference of 0.010%).
| Demographics | Rating | Rank | 1st Grade |
| Slovenes | 100.0 /100 | #12 | Exceptional 98.7% |
| Carpatho Rusyns | 100.0 /100 | #13 | Exceptional 98.6% |
| English | 100.0 /100 | #14 | Exceptional 98.6% |
| Swedes | 100.0 /100 | #15 | Exceptional 98.6% |
| Aleuts | 100.0 /100 | #16 | Exceptional 98.6% |
| Scottish | 100.0 /100 | #17 | Exceptional 98.6% |
| Dutch | 100.0 /100 | #18 | Exceptional 98.6% |
| Irish | 100.0 /100 | #19 | Exceptional 98.6% |
| Sioux | 100.0 /100 | #20 | Exceptional 98.6% |
| Arapaho | 100.0 /100 | #21 | Exceptional 98.6% |
| Pennsylvania Germans | 100.0 /100 | #22 | Exceptional 98.6% |
| Finns | 100.0 /100 | #23 | Exceptional 98.6% |
| Lithuanians | 100.0 /100 | #24 | Exceptional 98.6% |
| Danes | 100.0 /100 | #25 | Exceptional 98.6% |
| Scotch-Irish | 100.0 /100 | #26 | Exceptional 98.6% |