Immigrants from Laos vs English 4th Grade
COMPARE
Immigrants from Laos
English
4th Grade
4th Grade Comparison
Immigrants from Laos
English
96.3%
4TH GRADE
0.0/ 100
METRIC RATING
308th/ 347
METRIC RANK
98.4%
4TH GRADE
100.0/ 100
METRIC RATING
11th/ 347
METRIC RANK
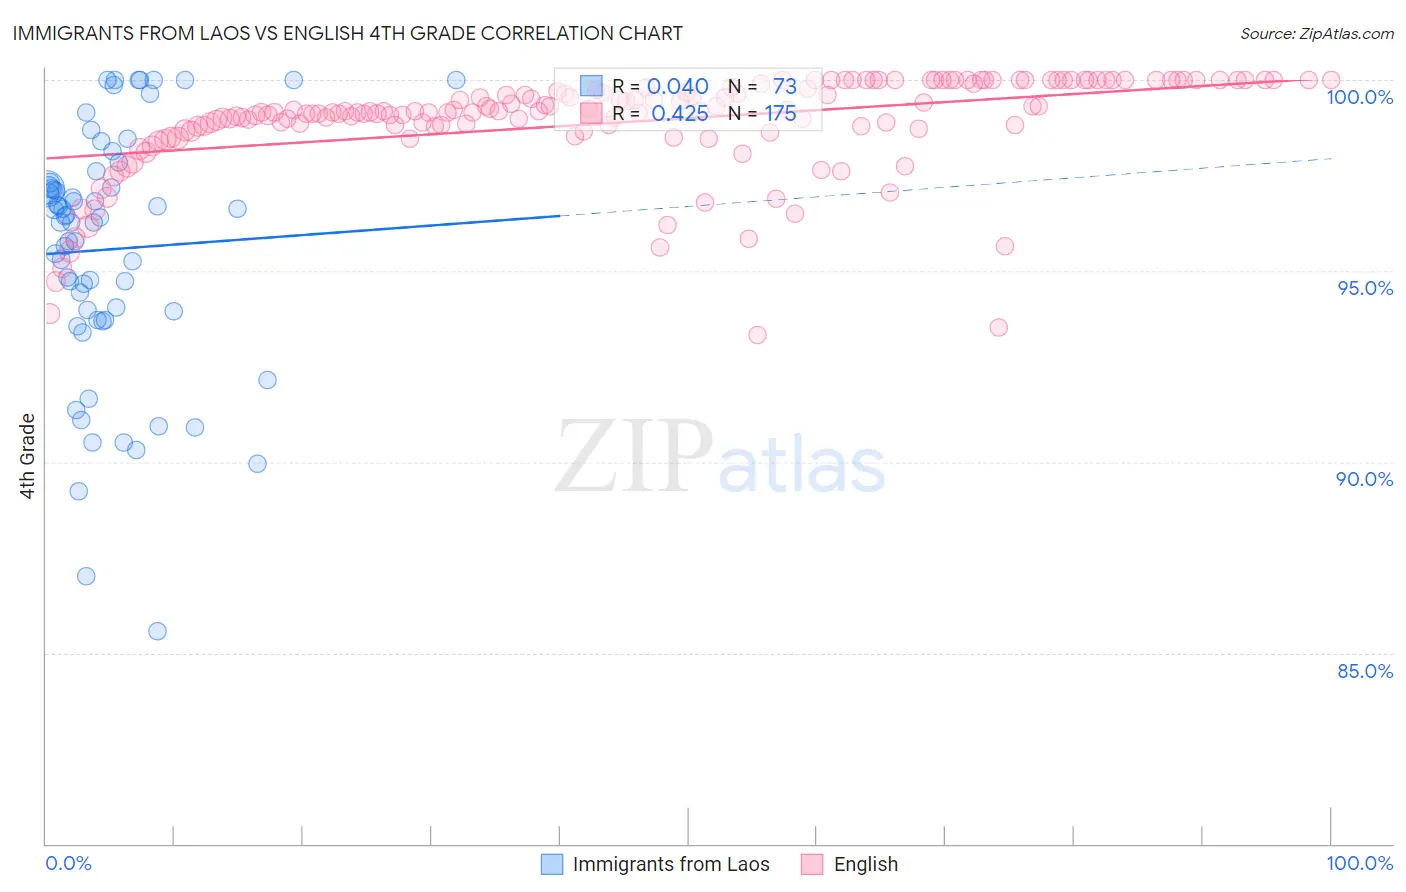
Immigrants from Laos vs English 4th Grade Correlation Chart
The statistical analysis conducted on geographies consisting of 201,453,273 people shows no correlation between the proportion of Immigrants from Laos and percentage of population with at least 4th grade education in the United States with a correlation coefficient (R) of 0.040 and weighted average of 96.3%. Similarly, the statistical analysis conducted on geographies consisting of 579,981,272 people shows a moderate positive correlation between the proportion of English and percentage of population with at least 4th grade education in the United States with a correlation coefficient (R) of 0.425 and weighted average of 98.4%, a difference of 2.2%.
4th Grade Correlation Summary
| Measurement | Immigrants from Laos | English |
| Minimum | 85.6% | 93.3% |
| Maximum | 100.0% | 100.0% |
| Range | 14.4% | 6.7% |
| Mean | 95.6% | 98.9% |
| Median | 96.4% | 99.2% |
| Interquartile 25% (IQ1) | 93.8% | 98.7% |
| Interquartile 75% (IQ3) | 97.2% | 99.9% |
| Interquartile Range (IQR) | 3.4% | 1.2% |
| Standard Deviation (Sample) | 3.2% | 1.3% |
| Standard Deviation (Population) | 3.2% | 1.3% |
Similar Demographics by 4th Grade
Demographics Similar to Immigrants from Laos by 4th Grade
In terms of 4th grade, the demographic groups most similar to Immigrants from Laos are Immigrants from Guyana (96.3%, a difference of 0.0%), Immigrants from Haiti (96.3%, a difference of 0.010%), Sri Lankan (96.4%, a difference of 0.030%), Immigrants from Burma/Myanmar (96.3%, a difference of 0.030%), and Immigrants from Caribbean (96.4%, a difference of 0.050%).
| Demographics | Rating | Rank | 4th Grade |
| Immigrants | Immigrants | 0.0 /100 | #301 | Tragic 96.5% |
| Immigrants | Cuba | 0.0 /100 | #302 | Tragic 96.4% |
| Guyanese | 0.0 /100 | #303 | Tragic 96.4% |
| Ecuadorians | 0.0 /100 | #304 | Tragic 96.4% |
| Immigrants | Caribbean | 0.0 /100 | #305 | Tragic 96.4% |
| Sri Lankans | 0.0 /100 | #306 | Tragic 96.4% |
| Immigrants | Haiti | 0.0 /100 | #307 | Tragic 96.3% |
| Immigrants | Laos | 0.0 /100 | #308 | Tragic 96.3% |
| Immigrants | Guyana | 0.0 /100 | #309 | Tragic 96.3% |
| Immigrants | Burma/Myanmar | 0.0 /100 | #310 | Tragic 96.3% |
| Immigrants | Bangladesh | 0.0 /100 | #311 | Tragic 96.2% |
| Cape Verdeans | 0.0 /100 | #312 | Tragic 96.2% |
| Indonesians | 0.0 /100 | #313 | Tragic 96.2% |
| Vietnamese | 0.0 /100 | #314 | Tragic 96.2% |
| Nicaraguans | 0.0 /100 | #315 | Tragic 96.2% |
Demographics Similar to English by 4th Grade
In terms of 4th grade, the demographic groups most similar to English are Tlingit-Haida (98.4%, a difference of 0.0%), Swedish (98.4%, a difference of 0.0%), Alaskan Athabascan (98.4%, a difference of 0.010%), Carpatho Rusyn (98.4%, a difference of 0.010%), and Slovene (98.4%, a difference of 0.030%).
| Demographics | Rating | Rank | 4th Grade |
| Inupiat | 100.0 /100 | #4 | Exceptional 98.6% |
| Yup'ik | 100.0 /100 | #5 | Exceptional 98.5% |
| Norwegians | 100.0 /100 | #6 | Exceptional 98.5% |
| Slovaks | 100.0 /100 | #7 | Exceptional 98.5% |
| Germans | 100.0 /100 | #8 | Exceptional 98.5% |
| Slovenes | 100.0 /100 | #9 | Exceptional 98.4% |
| Alaskan Athabascans | 100.0 /100 | #10 | Exceptional 98.4% |
| English | 100.0 /100 | #11 | Exceptional 98.4% |
| Tlingit-Haida | 100.0 /100 | #12 | Exceptional 98.4% |
| Swedes | 100.0 /100 | #13 | Exceptional 98.4% |
| Carpatho Rusyns | 100.0 /100 | #14 | Exceptional 98.4% |
| Dutch | 100.0 /100 | #15 | Exceptional 98.4% |
| Scottish | 100.0 /100 | #16 | Exceptional 98.4% |
| Pennsylvania Germans | 100.0 /100 | #17 | Exceptional 98.4% |
| Poles | 100.0 /100 | #18 | Exceptional 98.4% |