Malaysian vs Crow 8th Grade
COMPARE
Malaysian
Crow
8th Grade
8th Grade Comparison
Malaysians
Crow
94.5%
8TH GRADE
0.0/ 100
METRIC RATING
288th/ 347
METRIC RANK
99.0%
8TH GRADE
100.0/ 100
METRIC RATING
1st/ 347
METRIC RANK
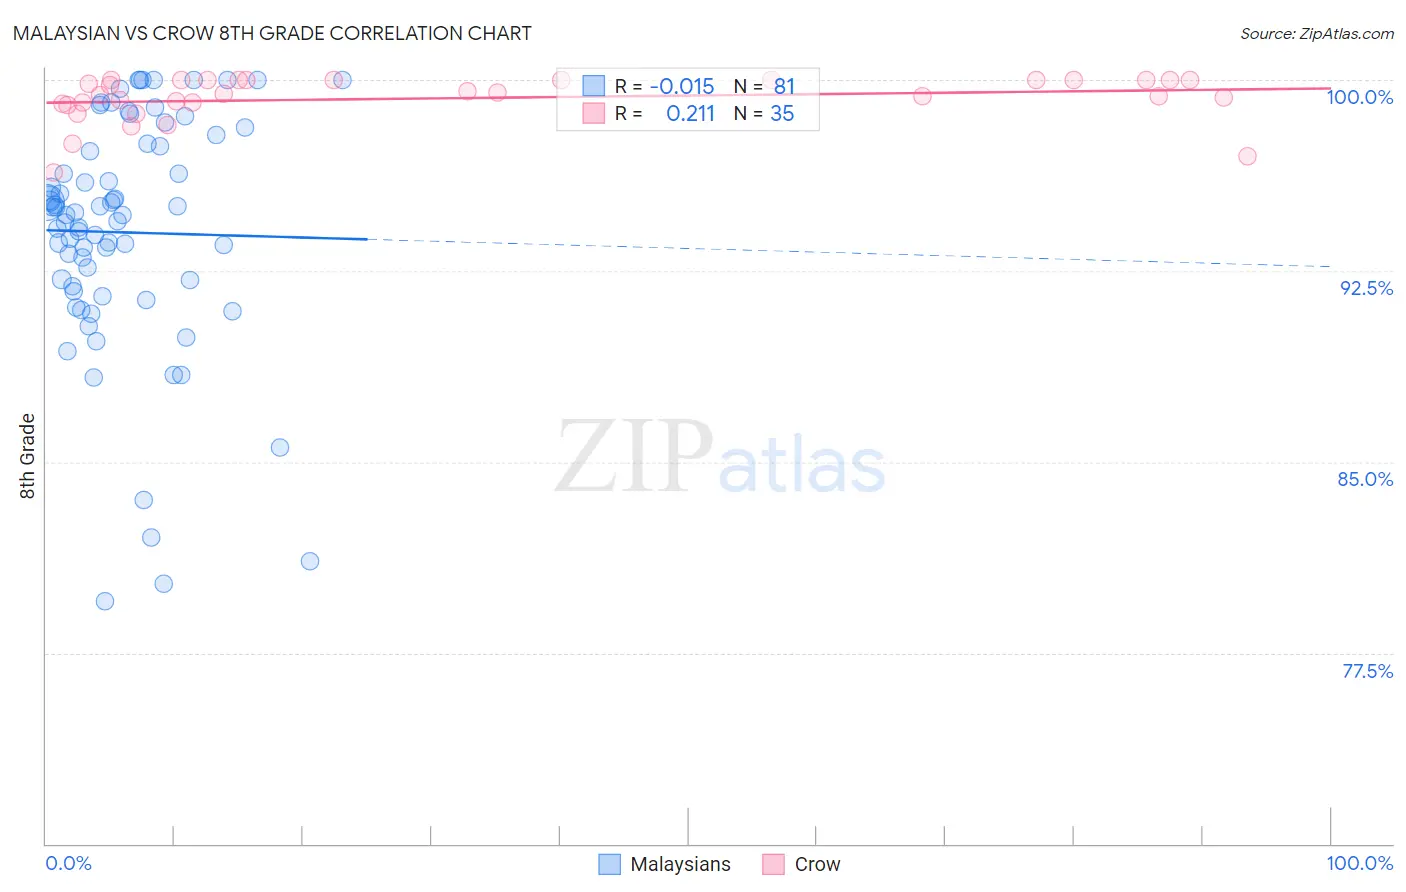
Malaysian vs Crow 8th Grade Correlation Chart
The statistical analysis conducted on geographies consisting of 226,107,000 people shows no correlation between the proportion of Malaysians and percentage of population with at least 8th grade education in the United States with a correlation coefficient (R) of -0.015 and weighted average of 94.5%. Similarly, the statistical analysis conducted on geographies consisting of 665,246 people shows a weak positive correlation between the proportion of Crow and percentage of population with at least 8th grade education in the United States with a correlation coefficient (R) of 0.211 and weighted average of 99.0%, a difference of 4.9%.
8th Grade Correlation Summary
| Measurement | Malaysian | Crow |
| Minimum | 79.5% | 96.4% |
| Maximum | 100.0% | 100.0% |
| Range | 20.5% | 3.6% |
| Mean | 94.0% | 99.3% |
| Median | 94.7% | 99.5% |
| Interquartile 25% (IQ1) | 91.8% | 99.1% |
| Interquartile 75% (IQ3) | 97.4% | 100.0% |
| Interquartile Range (IQR) | 5.6% | 0.92% |
| Standard Deviation (Sample) | 4.7% | 0.90% |
| Standard Deviation (Population) | 4.6% | 0.89% |
Similar Demographics by 8th Grade
Demographics Similar to Malaysians by 8th Grade
In terms of 8th grade, the demographic groups most similar to Malaysians are Tohono O'odham (94.5%, a difference of 0.020%), Immigrants from Peru (94.5%, a difference of 0.030%), British West Indian (94.4%, a difference of 0.060%), Immigrants from Barbados (94.5%, a difference of 0.080%), and Immigrants from Philippines (94.6%, a difference of 0.11%).
| Demographics | Rating | Rank | 8th Grade |
| Immigrants | Bolivia | 0.1 /100 | #281 | Tragic 94.6% |
| Immigrants | Eritrea | 0.1 /100 | #282 | Tragic 94.6% |
| Immigrants | St. Vincent and the Grenadines | 0.1 /100 | #283 | Tragic 94.6% |
| Immigrants | Philippines | 0.1 /100 | #284 | Tragic 94.6% |
| Immigrants | Barbados | 0.0 /100 | #285 | Tragic 94.5% |
| Immigrants | Peru | 0.0 /100 | #286 | Tragic 94.5% |
| Tohono O'odham | 0.0 /100 | #287 | Tragic 94.5% |
| Malaysians | 0.0 /100 | #288 | Tragic 94.5% |
| British West Indians | 0.0 /100 | #289 | Tragic 94.4% |
| Immigrants | West Indies | 0.0 /100 | #290 | Tragic 94.3% |
| Immigrants | Grenada | 0.0 /100 | #291 | Tragic 94.3% |
| Bangladeshis | 0.0 /100 | #292 | Tragic 94.3% |
| Yaqui | 0.0 /100 | #293 | Tragic 94.2% |
| Houma | 0.0 /100 | #294 | Tragic 94.2% |
| Fijians | 0.0 /100 | #295 | Tragic 94.2% |
Demographics Similar to Crow by 8th Grade
In terms of 8th grade, the demographic groups most similar to Crow are Tsimshian (99.0%, a difference of 0.090%), Finnish (98.4%, a difference of 0.69%), Carpatho Rusyn (98.1%, a difference of 0.92%), Ottawa (97.9%, a difference of 1.1%), and Dutch (97.7%, a difference of 1.4%).
| Demographics | Rating | Rank | 8th Grade |
| Crow | 100.0 /100 | #1 | Exceptional 99.0% |
| Tsimshian | 100.0 /100 | #2 | Exceptional 99.0% |
| Finns | 100.0 /100 | #3 | Exceptional 98.4% |
| Carpatho Rusyns | 100.0 /100 | #4 | Exceptional 98.1% |
| Ottawa | 100.0 /100 | #5 | Exceptional 97.9% |
| Dutch | 100.0 /100 | #6 | Exceptional 97.7% |
| Norwegians | 100.0 /100 | #7 | Exceptional 97.6% |
| Slovaks | 100.0 /100 | #8 | Exceptional 97.6% |
| Germans | 100.0 /100 | #9 | Exceptional 97.5% |
| Slovenes | 100.0 /100 | #10 | Exceptional 97.5% |
| Poles | 100.0 /100 | #11 | Exceptional 97.4% |
| Swedes | 100.0 /100 | #12 | Exceptional 97.4% |
| Alaskan Athabascans | 100.0 /100 | #13 | Exceptional 97.3% |
| English | 100.0 /100 | #14 | Exceptional 97.3% |
| Pennsylvania Germans | 100.0 /100 | #15 | Exceptional 97.3% |