Immigrants from Kazakhstan vs Immigrants from Bulgaria Professional Degree
COMPARE
Immigrants from Kazakhstan
Immigrants from Bulgaria
Professional Degree
Professional Degree Comparison
Immigrants from Kazakhstan
Immigrants from Bulgaria
5.5%
PROFESSIONAL DEGREE
99.9/ 100
METRIC RATING
66th/ 347
METRIC RANK
5.5%
PROFESSIONAL DEGREE
99.9/ 100
METRIC RATING
67th/ 347
METRIC RANK
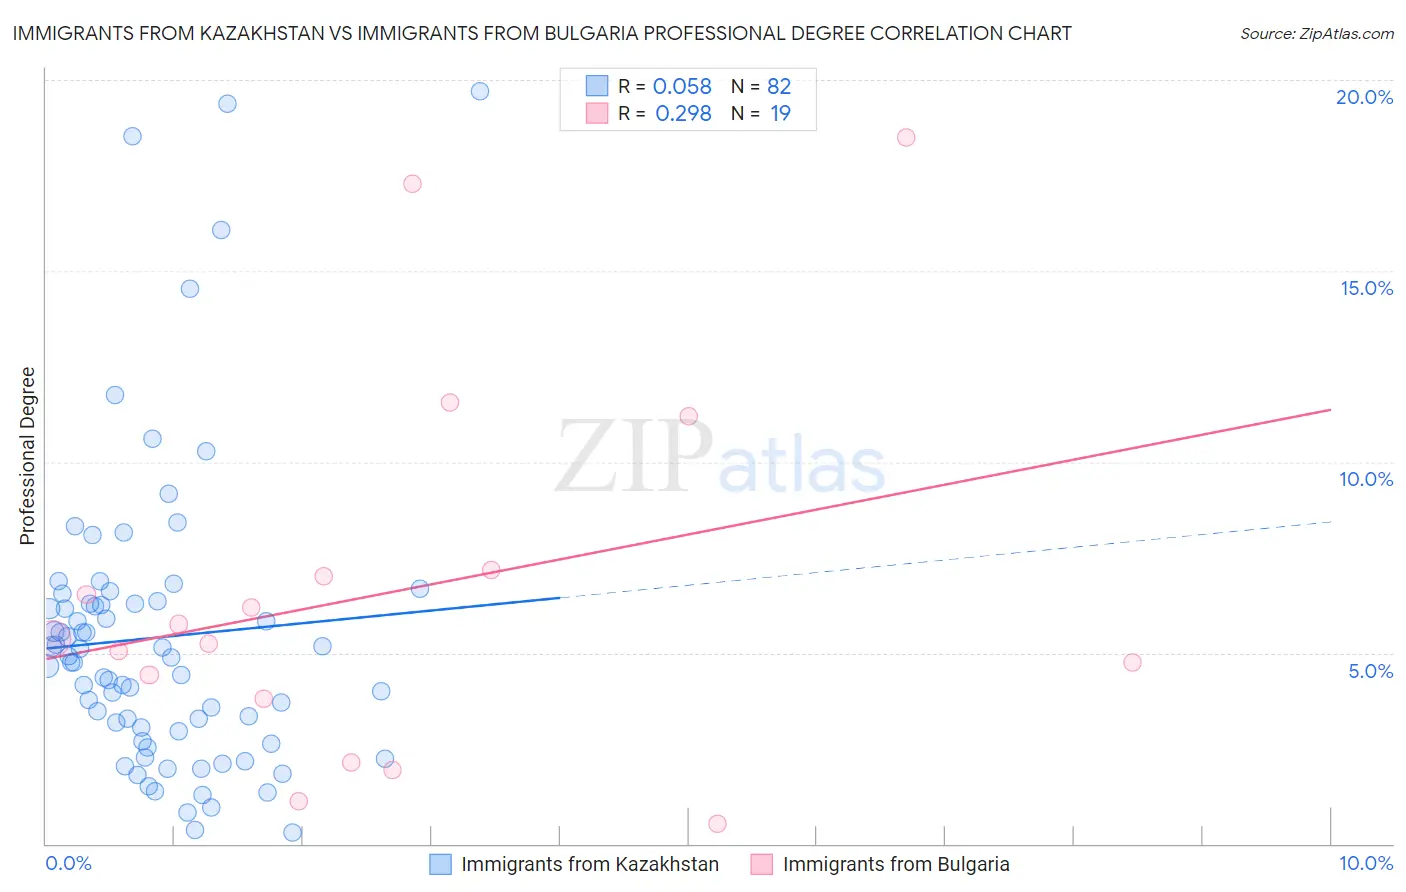
Immigrants from Kazakhstan vs Immigrants from Bulgaria Professional Degree Correlation Chart
The statistical analysis conducted on geographies consisting of 124,400,013 people shows a slight positive correlation between the proportion of Immigrants from Kazakhstan and percentage of population with at least professional degree education in the United States with a correlation coefficient (R) of 0.058 and weighted average of 5.5%. Similarly, the statistical analysis conducted on geographies consisting of 172,510,370 people shows a weak positive correlation between the proportion of Immigrants from Bulgaria and percentage of population with at least professional degree education in the United States with a correlation coefficient (R) of 0.298 and weighted average of 5.5%, a difference of 0.32%.
Professional Degree Correlation Summary
| Measurement | Immigrants from Kazakhstan | Immigrants from Bulgaria |
| Minimum | 0.30% | 0.51% |
| Maximum | 19.7% | 18.5% |
| Range | 19.4% | 18.0% |
| Mean | 5.4% | 6.6% |
| Median | 4.8% | 5.4% |
| Interquartile 25% (IQ1) | 2.9% | 3.8% |
| Interquartile 75% (IQ3) | 6.3% | 7.2% |
| Interquartile Range (IQR) | 3.4% | 3.4% |
| Standard Deviation (Sample) | 3.9% | 4.9% |
| Standard Deviation (Population) | 3.9% | 4.8% |
Demographics Similar to Immigrants from Kazakhstan and Immigrants from Bulgaria by Professional Degree
In terms of professional degree, the demographic groups most similar to Immigrants from Kazakhstan are Immigrants from Bolivia (5.5%, a difference of 0.24%), Immigrants from Asia (5.5%, a difference of 0.30%), Asian (5.5%, a difference of 0.36%), Immigrants from Lebanon (5.5%, a difference of 0.51%), and Immigrants from Hungary (5.5%, a difference of 0.59%). Similarly, the demographic groups most similar to Immigrants from Bulgaria are Immigrants from Lebanon (5.5%, a difference of 0.18%), Immigrants from Hungary (5.5%, a difference of 0.26%), Immigrants from Bolivia (5.5%, a difference of 0.56%), Bhutanese (5.4%, a difference of 0.59%), and Immigrants from Asia (5.5%, a difference of 0.62%).
| Demographics | Rating | Rank | Professional Degree |
| Immigrants | Malaysia | 100.0 /100 | #56 | Exceptional 5.7% |
| South Africans | 100.0 /100 | #57 | Exceptional 5.7% |
| Bulgarians | 100.0 /100 | #58 | Exceptional 5.7% |
| Immigrants | Europe | 100.0 /100 | #59 | Exceptional 5.6% |
| Bolivians | 99.9 /100 | #60 | Exceptional 5.6% |
| Immigrants | Lithuania | 99.9 /100 | #61 | Exceptional 5.6% |
| Immigrants | Belarus | 99.9 /100 | #62 | Exceptional 5.5% |
| Asians | 99.9 /100 | #63 | Exceptional 5.5% |
| Immigrants | Asia | 99.9 /100 | #64 | Exceptional 5.5% |
| Immigrants | Bolivia | 99.9 /100 | #65 | Exceptional 5.5% |
| Immigrants | Kazakhstan | 99.9 /100 | #66 | Exceptional 5.5% |
| Immigrants | Bulgaria | 99.9 /100 | #67 | Exceptional 5.5% |
| Immigrants | Lebanon | 99.9 /100 | #68 | Exceptional 5.5% |
| Immigrants | Hungary | 99.9 /100 | #69 | Exceptional 5.5% |
| Bhutanese | 99.8 /100 | #70 | Exceptional 5.4% |
| Immigrants | Western Asia | 99.8 /100 | #71 | Exceptional 5.4% |
| Lithuanians | 99.8 /100 | #72 | Exceptional 5.4% |
| Immigrants | Romania | 99.8 /100 | #73 | Exceptional 5.4% |
| Ethiopians | 99.7 /100 | #74 | Exceptional 5.4% |
| Immigrants | Indonesia | 99.7 /100 | #75 | Exceptional 5.3% |
| Immigrants | Canada | 99.7 /100 | #76 | Exceptional 5.3% |