Immigrants from Jordan vs Serbian 3rd Grade
COMPARE
Immigrants from Jordan
Serbian
3rd Grade
3rd Grade Comparison
Immigrants from Jordan
Serbians
97.8%
3RD GRADE
57.9/ 100
METRIC RATING
162nd/ 347
METRIC RANK
98.2%
3RD GRADE
99.6/ 100
METRIC RATING
66th/ 347
METRIC RANK
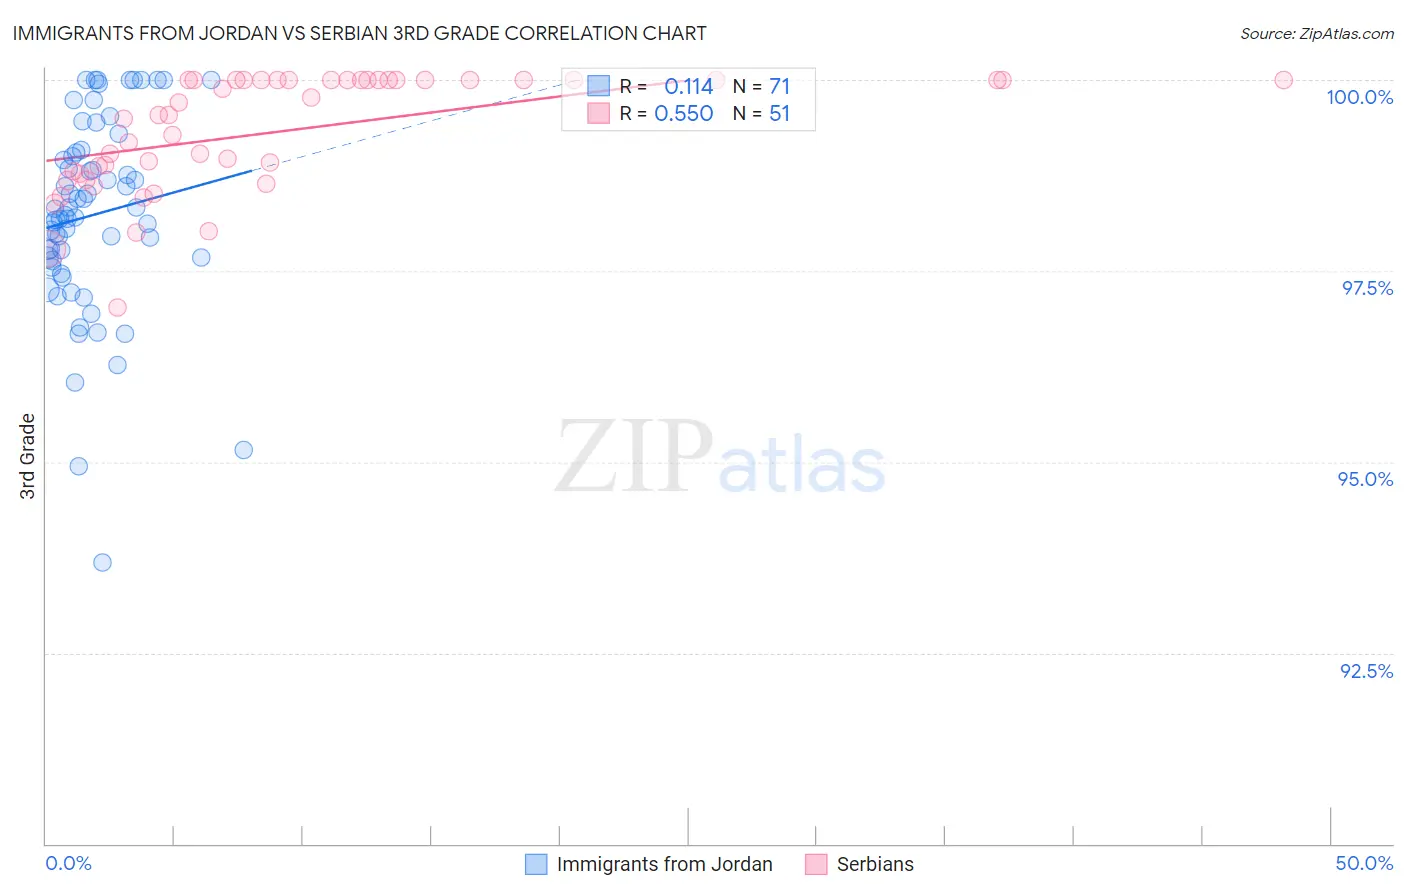
Immigrants from Jordan vs Serbian 3rd Grade Correlation Chart
The statistical analysis conducted on geographies consisting of 181,269,915 people shows a poor positive correlation between the proportion of Immigrants from Jordan and percentage of population with at least 3rd grade education in the United States with a correlation coefficient (R) of 0.114 and weighted average of 97.8%. Similarly, the statistical analysis conducted on geographies consisting of 267,642,942 people shows a substantial positive correlation between the proportion of Serbians and percentage of population with at least 3rd grade education in the United States with a correlation coefficient (R) of 0.550 and weighted average of 98.2%, a difference of 0.44%.
3rd Grade Correlation Summary
| Measurement | Immigrants from Jordan | Serbian |
| Minimum | 93.7% | 97.0% |
| Maximum | 100.0% | 100.0% |
| Range | 6.3% | 3.0% |
| Mean | 98.2% | 99.3% |
| Median | 98.2% | 99.5% |
| Interquartile 25% (IQ1) | 97.6% | 98.8% |
| Interquartile 75% (IQ3) | 99.1% | 100.0% |
| Interquartile Range (IQR) | 1.4% | 1.2% |
| Standard Deviation (Sample) | 1.3% | 0.75% |
| Standard Deviation (Population) | 1.3% | 0.75% |
Similar Demographics by 3rd Grade
Demographics Similar to Immigrants from Jordan by 3rd Grade
In terms of 3rd grade, the demographic groups most similar to Immigrants from Jordan are Immigrants from Iran (97.8%, a difference of 0.0%), Albanian (97.8%, a difference of 0.0%), Marshallese (97.8%, a difference of 0.0%), Immigrants from Russia (97.8%, a difference of 0.010%), and Immigrants from Italy (97.8%, a difference of 0.010%).
| Demographics | Rating | Rank | 3rd Grade |
| Bermudans | 62.6 /100 | #155 | Good 97.8% |
| Immigrants | Russia | 61.7 /100 | #156 | Good 97.8% |
| Immigrants | Italy | 61.2 /100 | #157 | Good 97.8% |
| Venezuelans | 60.9 /100 | #158 | Good 97.8% |
| French American Indians | 60.0 /100 | #159 | Average 97.8% |
| Immigrants | Iran | 59.1 /100 | #160 | Average 97.8% |
| Albanians | 58.8 /100 | #161 | Average 97.8% |
| Immigrants | Jordan | 57.9 /100 | #162 | Average 97.8% |
| Marshallese | 57.2 /100 | #163 | Average 97.8% |
| Immigrants | Bosnia and Herzegovina | 56.2 /100 | #164 | Average 97.8% |
| Ugandans | 56.1 /100 | #165 | Average 97.8% |
| Dutch West Indians | 55.5 /100 | #166 | Average 97.8% |
| Chileans | 55.3 /100 | #167 | Average 97.8% |
| Immigrants | Spain | 54.3 /100 | #168 | Average 97.8% |
| Comanche | 53.8 /100 | #169 | Average 97.8% |
Demographics Similar to Serbians by 3rd Grade
In terms of 3rd grade, the demographic groups most similar to Serbians are New Zealander (98.2%, a difference of 0.0%), Russian (98.2%, a difference of 0.0%), Immigrants from Northern Europe (98.2%, a difference of 0.0%), Canadian (98.2%, a difference of 0.0%), and Kiowa (98.2%, a difference of 0.010%).
| Demographics | Rating | Rank | 3rd Grade |
| Maltese | 99.7 /100 | #59 | Exceptional 98.3% |
| Creek | 99.7 /100 | #60 | Exceptional 98.2% |
| Pueblo | 99.7 /100 | #61 | Exceptional 98.2% |
| Immigrants | Canada | 99.7 /100 | #62 | Exceptional 98.2% |
| Immigrants | North America | 99.7 /100 | #63 | Exceptional 98.2% |
| Kiowa | 99.6 /100 | #64 | Exceptional 98.2% |
| New Zealanders | 99.6 /100 | #65 | Exceptional 98.2% |
| Serbians | 99.6 /100 | #66 | Exceptional 98.2% |
| Russians | 99.6 /100 | #67 | Exceptional 98.2% |
| Immigrants | Northern Europe | 99.6 /100 | #68 | Exceptional 98.2% |
| Canadians | 99.6 /100 | #69 | Exceptional 98.2% |
| Cajuns | 99.6 /100 | #70 | Exceptional 98.2% |
| Immigrants | Austria | 99.6 /100 | #71 | Exceptional 98.2% |
| Chickasaw | 99.5 /100 | #72 | Exceptional 98.2% |
| Cheyenne | 99.3 /100 | #73 | Exceptional 98.2% |