Immigrants from Eastern Africa vs Serbian 3rd Grade
COMPARE
Immigrants from Eastern Africa
Serbian
3rd Grade
3rd Grade Comparison
Immigrants from Eastern Africa
Serbians
97.4%
3RD GRADE
0.9/ 100
METRIC RATING
248th/ 347
METRIC RANK
98.2%
3RD GRADE
99.6/ 100
METRIC RATING
66th/ 347
METRIC RANK
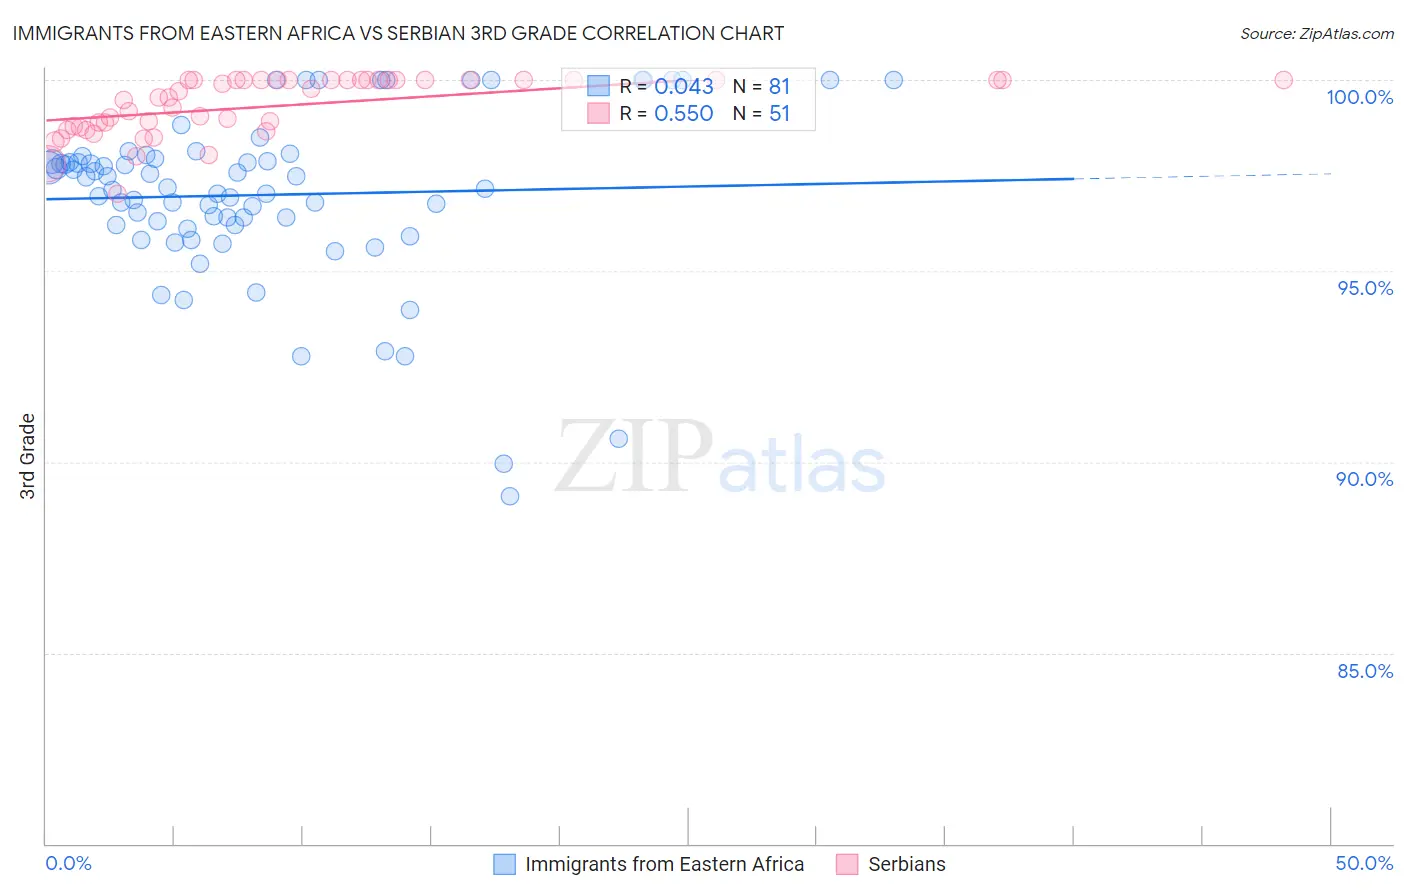
Immigrants from Eastern Africa vs Serbian 3rd Grade Correlation Chart
The statistical analysis conducted on geographies consisting of 355,144,184 people shows no correlation between the proportion of Immigrants from Eastern Africa and percentage of population with at least 3rd grade education in the United States with a correlation coefficient (R) of 0.043 and weighted average of 97.4%. Similarly, the statistical analysis conducted on geographies consisting of 267,642,942 people shows a substantial positive correlation between the proportion of Serbians and percentage of population with at least 3rd grade education in the United States with a correlation coefficient (R) of 0.550 and weighted average of 98.2%, a difference of 0.87%.
3rd Grade Correlation Summary
| Measurement | Immigrants from Eastern Africa | Serbian |
| Minimum | 89.1% | 97.0% |
| Maximum | 100.0% | 100.0% |
| Range | 10.9% | 3.0% |
| Mean | 97.0% | 99.3% |
| Median | 97.2% | 99.5% |
| Interquartile 25% (IQ1) | 96.2% | 98.8% |
| Interquartile 75% (IQ3) | 98.0% | 100.0% |
| Interquartile Range (IQR) | 1.8% | 1.2% |
| Standard Deviation (Sample) | 2.2% | 0.75% |
| Standard Deviation (Population) | 2.2% | 0.75% |
Similar Demographics by 3rd Grade
Demographics Similar to Immigrants from Eastern Africa by 3rd Grade
In terms of 3rd grade, the demographic groups most similar to Immigrants from Eastern Africa are Assyrian/Chaldean/Syriac (97.4%, a difference of 0.0%), South American (97.4%, a difference of 0.0%), Immigrants from Senegal (97.4%, a difference of 0.010%), Immigrants from Middle Africa (97.4%, a difference of 0.010%), and Immigrants from Asia (97.4%, a difference of 0.010%).
| Demographics | Rating | Rank | 3rd Grade |
| Immigrants | Indonesia | 1.4 /100 | #241 | Tragic 97.4% |
| Koreans | 1.3 /100 | #242 | Tragic 97.4% |
| Indians (Asian) | 1.3 /100 | #243 | Tragic 97.4% |
| Asians | 1.1 /100 | #244 | Tragic 97.4% |
| Ethiopians | 1.1 /100 | #245 | Tragic 97.4% |
| Immigrants | Senegal | 1.0 /100 | #246 | Tragic 97.4% |
| Assyrians/Chaldeans/Syriacs | 1.0 /100 | #247 | Tragic 97.4% |
| Immigrants | Eastern Africa | 0.9 /100 | #248 | Tragic 97.4% |
| South Americans | 0.9 /100 | #249 | Tragic 97.4% |
| Immigrants | Middle Africa | 0.9 /100 | #250 | Tragic 97.4% |
| Immigrants | Asia | 0.8 /100 | #251 | Tragic 97.4% |
| Peruvians | 0.8 /100 | #252 | Tragic 97.4% |
| Immigrants | Africa | 0.8 /100 | #253 | Tragic 97.4% |
| Jamaicans | 0.7 /100 | #254 | Tragic 97.4% |
| Bolivians | 0.6 /100 | #255 | Tragic 97.3% |
Demographics Similar to Serbians by 3rd Grade
In terms of 3rd grade, the demographic groups most similar to Serbians are New Zealander (98.2%, a difference of 0.0%), Russian (98.2%, a difference of 0.0%), Immigrants from Northern Europe (98.2%, a difference of 0.0%), Canadian (98.2%, a difference of 0.0%), and Kiowa (98.2%, a difference of 0.010%).
| Demographics | Rating | Rank | 3rd Grade |
| Maltese | 99.7 /100 | #59 | Exceptional 98.3% |
| Creek | 99.7 /100 | #60 | Exceptional 98.2% |
| Pueblo | 99.7 /100 | #61 | Exceptional 98.2% |
| Immigrants | Canada | 99.7 /100 | #62 | Exceptional 98.2% |
| Immigrants | North America | 99.7 /100 | #63 | Exceptional 98.2% |
| Kiowa | 99.6 /100 | #64 | Exceptional 98.2% |
| New Zealanders | 99.6 /100 | #65 | Exceptional 98.2% |
| Serbians | 99.6 /100 | #66 | Exceptional 98.2% |
| Russians | 99.6 /100 | #67 | Exceptional 98.2% |
| Immigrants | Northern Europe | 99.6 /100 | #68 | Exceptional 98.2% |
| Canadians | 99.6 /100 | #69 | Exceptional 98.2% |
| Cajuns | 99.6 /100 | #70 | Exceptional 98.2% |
| Immigrants | Austria | 99.6 /100 | #71 | Exceptional 98.2% |
| Chickasaw | 99.5 /100 | #72 | Exceptional 98.2% |
| Cheyenne | 99.3 /100 | #73 | Exceptional 98.2% |