Immigrants from Jordan vs Assyrian/Chaldean/Syriac 11th Grade
COMPARE
Immigrants from Jordan
Assyrian/Chaldean/Syriac
11th Grade
11th Grade Comparison
Immigrants from Jordan
Assyrians/Chaldeans/Syriacs
93.1%
11TH GRADE
92.4/ 100
METRIC RATING
128th/ 347
METRIC RANK
92.8%
11TH GRADE
80.5/ 100
METRIC RATING
144th/ 347
METRIC RANK
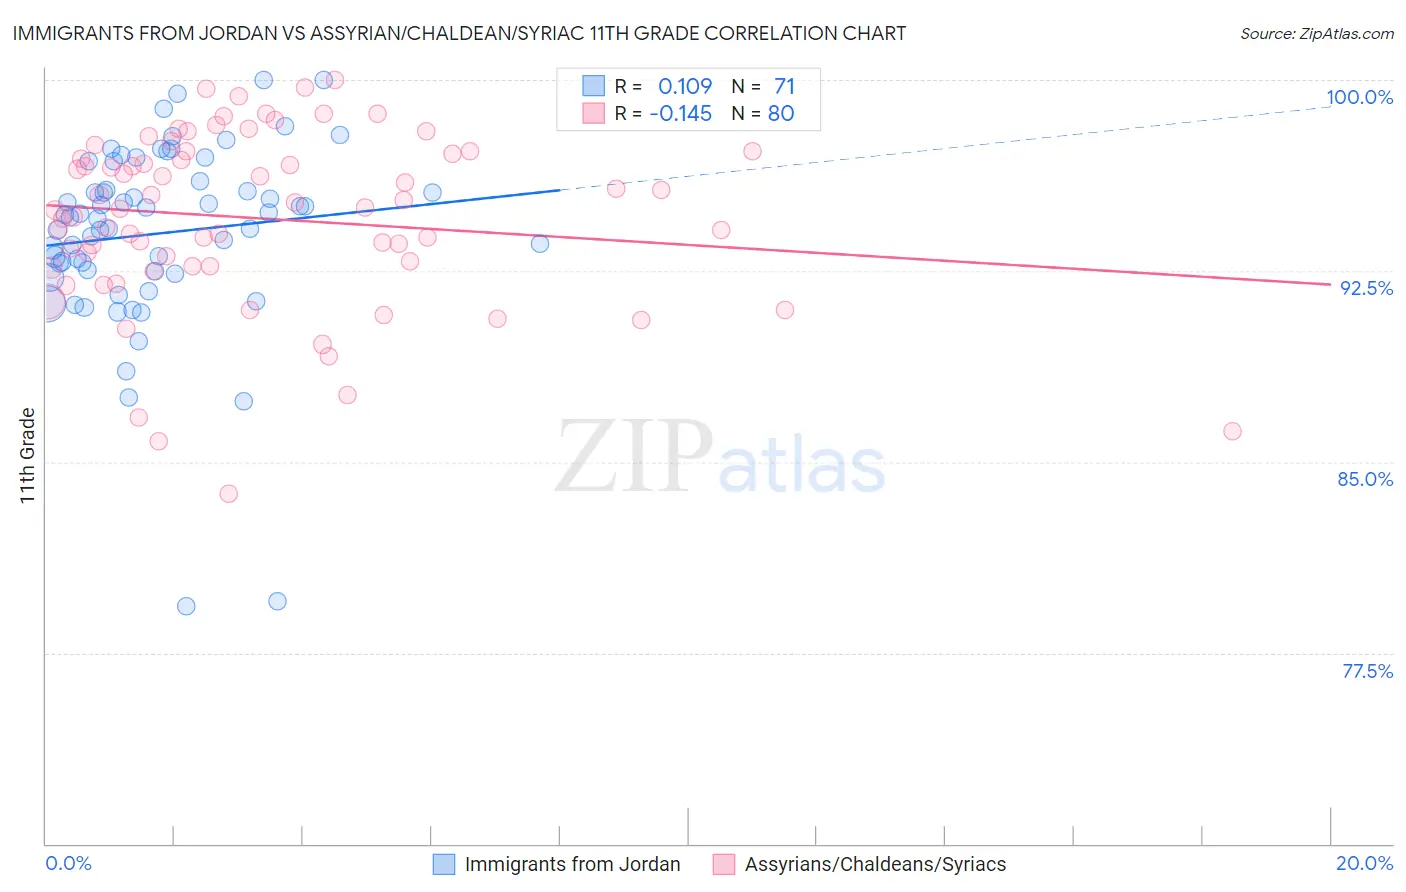
Immigrants from Jordan vs Assyrian/Chaldean/Syriac 11th Grade Correlation Chart
The statistical analysis conducted on geographies consisting of 181,278,272 people shows a poor positive correlation between the proportion of Immigrants from Jordan and percentage of population with at least 11th grade education in the United States with a correlation coefficient (R) of 0.109 and weighted average of 93.1%. Similarly, the statistical analysis conducted on geographies consisting of 110,318,125 people shows a poor negative correlation between the proportion of Assyrians/Chaldeans/Syriacs and percentage of population with at least 11th grade education in the United States with a correlation coefficient (R) of -0.145 and weighted average of 92.8%, a difference of 0.26%.
11th Grade Correlation Summary
| Measurement | Immigrants from Jordan | Assyrian/Chaldean/Syriac |
| Minimum | 79.3% | 83.8% |
| Maximum | 100.0% | 100.0% |
| Range | 20.7% | 16.2% |
| Mean | 94.0% | 94.6% |
| Median | 94.6% | 95.0% |
| Interquartile 25% (IQ1) | 92.5% | 92.7% |
| Interquartile 75% (IQ3) | 96.0% | 97.1% |
| Interquartile Range (IQR) | 3.5% | 4.5% |
| Standard Deviation (Sample) | 3.7% | 3.4% |
| Standard Deviation (Population) | 3.7% | 3.4% |
Demographics Similar to Immigrants from Jordan and Assyrians/Chaldeans/Syriacs by 11th Grade
In terms of 11th grade, the demographic groups most similar to Immigrants from Jordan are Immigrants from Kazakhstan (93.1%, a difference of 0.0%), Immigrants from Ukraine (93.0%, a difference of 0.080%), Albanian (93.0%, a difference of 0.090%), Egyptian (93.0%, a difference of 0.090%), and Immigrants from Bosnia and Herzegovina (93.0%, a difference of 0.10%). Similarly, the demographic groups most similar to Assyrians/Chaldeans/Syriacs are Pakistani (92.8%, a difference of 0.010%), Ugandan (92.9%, a difference of 0.020%), Iroquois (92.8%, a difference of 0.020%), Kenyan (92.9%, a difference of 0.030%), and Chilean (92.9%, a difference of 0.040%).
| Demographics | Rating | Rank | 11th Grade |
| Basques | 95.2 /100 | #126 | Exceptional 93.2% |
| Immigrants | Kazakhstan | 92.4 /100 | #127 | Exceptional 93.1% |
| Immigrants | Jordan | 92.4 /100 | #128 | Exceptional 93.1% |
| Immigrants | Ukraine | 89.8 /100 | #129 | Excellent 93.0% |
| Albanians | 89.5 /100 | #130 | Excellent 93.0% |
| Egyptians | 89.5 /100 | #131 | Excellent 93.0% |
| Immigrants | Bosnia and Herzegovina | 89.0 /100 | #132 | Excellent 93.0% |
| Mongolians | 87.6 /100 | #133 | Excellent 93.0% |
| Delaware | 87.3 /100 | #134 | Excellent 93.0% |
| Immigrants | Italy | 86.6 /100 | #135 | Excellent 92.9% |
| Cree | 85.9 /100 | #136 | Excellent 92.9% |
| Arabs | 85.4 /100 | #137 | Excellent 92.9% |
| Immigrants | Brazil | 85.1 /100 | #138 | Excellent 92.9% |
| Crow | 84.1 /100 | #139 | Excellent 92.9% |
| Venezuelans | 83.4 /100 | #140 | Excellent 92.9% |
| Chileans | 83.0 /100 | #141 | Excellent 92.9% |
| Kenyans | 82.0 /100 | #142 | Excellent 92.9% |
| Ugandans | 81.4 /100 | #143 | Excellent 92.9% |
| Assyrians/Chaldeans/Syriacs | 80.5 /100 | #144 | Excellent 92.8% |
| Pakistanis | 79.6 /100 | #145 | Good 92.8% |
| Iroquois | 79.1 /100 | #146 | Good 92.8% |