Immigrants from Europe vs Cuban 9th Grade
COMPARE
Immigrants from Europe
Cuban
9th Grade
9th Grade Comparison
Immigrants from Europe
Cubans
95.4%
9TH GRADE
95.7/ 100
METRIC RATING
116th/ 347
METRIC RANK
93.2%
9TH GRADE
0.0/ 100
METRIC RATING
294th/ 347
METRIC RANK
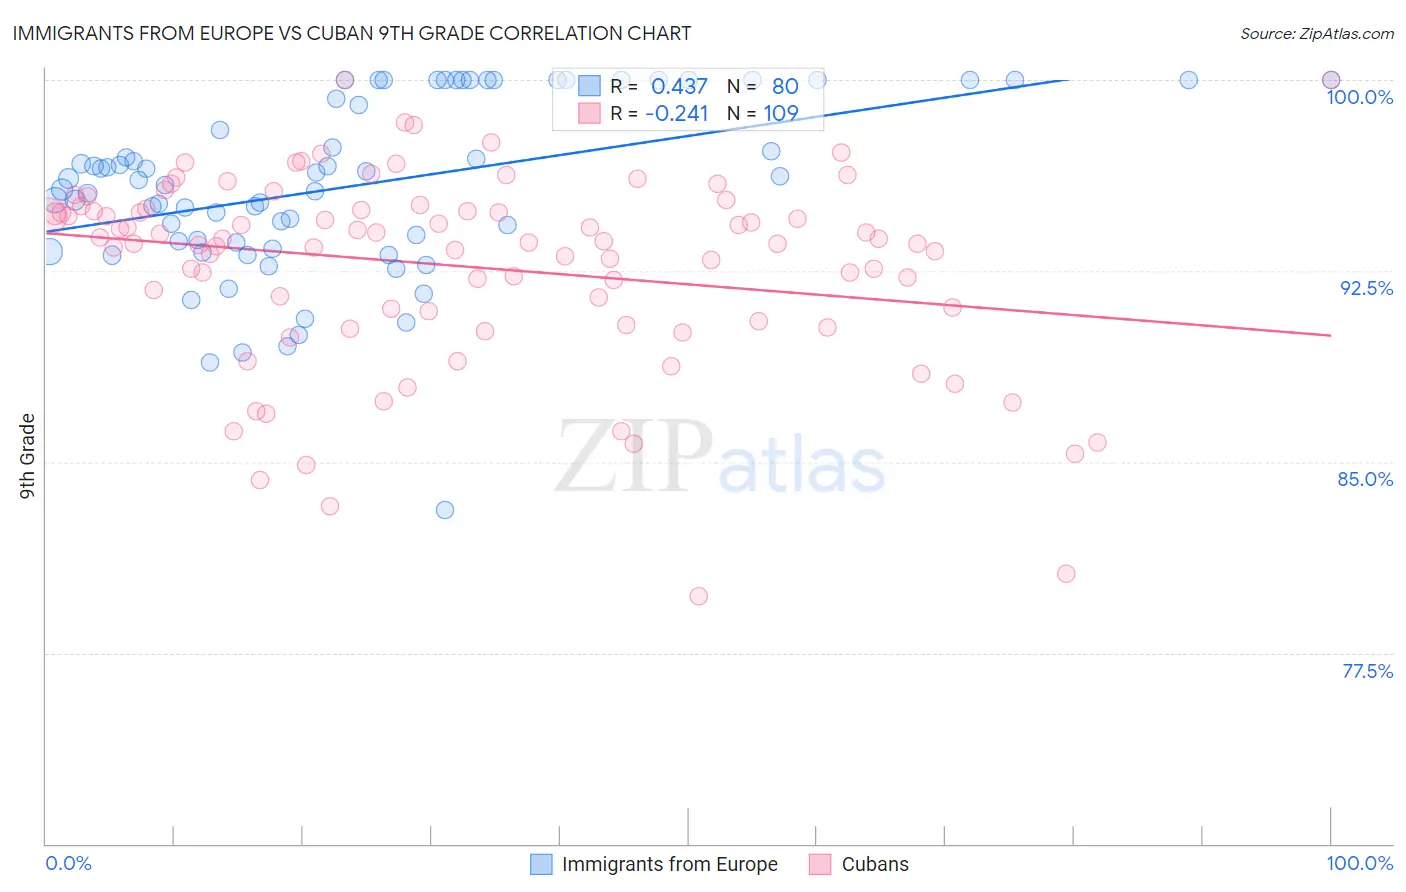
Immigrants from Europe vs Cuban 9th Grade Correlation Chart
The statistical analysis conducted on geographies consisting of 547,425,973 people shows a moderate positive correlation between the proportion of Immigrants from Europe and percentage of population with at least 9th grade education in the United States with a correlation coefficient (R) of 0.437 and weighted average of 95.4%. Similarly, the statistical analysis conducted on geographies consisting of 449,368,946 people shows a weak negative correlation between the proportion of Cubans and percentage of population with at least 9th grade education in the United States with a correlation coefficient (R) of -0.241 and weighted average of 93.2%, a difference of 2.4%.
9th Grade Correlation Summary
| Measurement | Immigrants from Europe | Cuban |
| Minimum | 83.1% | 79.7% |
| Maximum | 100.0% | 100.0% |
| Range | 16.9% | 20.3% |
| Mean | 95.9% | 92.7% |
| Median | 96.1% | 93.6% |
| Interquartile 25% (IQ1) | 93.6% | 90.7% |
| Interquartile 75% (IQ3) | 100.0% | 94.9% |
| Interquartile Range (IQR) | 6.4% | 4.2% |
| Standard Deviation (Sample) | 3.5% | 3.8% |
| Standard Deviation (Population) | 3.4% | 3.8% |
Similar Demographics by 9th Grade
Demographics Similar to Immigrants from Europe by 9th Grade
In terms of 9th grade, the demographic groups most similar to Immigrants from Europe are Immigrants from Romania (95.4%, a difference of 0.0%), Immigrants from Turkey (95.4%, a difference of 0.0%), Soviet Union (95.4%, a difference of 0.0%), Cambodian (95.4%, a difference of 0.0%), and Burmese (95.4%, a difference of 0.010%).
| Demographics | Rating | Rank | 9th Grade |
| Osage | 96.8 /100 | #109 | Exceptional 95.5% |
| Immigrants | Bulgaria | 96.7 /100 | #110 | Exceptional 95.5% |
| Cherokee | 96.3 /100 | #111 | Exceptional 95.4% |
| Immigrants | Croatia | 96.2 /100 | #112 | Exceptional 95.4% |
| Iroquois | 96.2 /100 | #113 | Exceptional 95.4% |
| German Russians | 96.1 /100 | #114 | Exceptional 95.4% |
| Burmese | 96.0 /100 | #115 | Exceptional 95.4% |
| Immigrants | Europe | 95.7 /100 | #116 | Exceptional 95.4% |
| Immigrants | Romania | 95.6 /100 | #117 | Exceptional 95.4% |
| Immigrants | Turkey | 95.6 /100 | #118 | Exceptional 95.4% |
| Soviet Union | 95.6 /100 | #119 | Exceptional 95.4% |
| Cambodians | 95.6 /100 | #120 | Exceptional 95.4% |
| Cree | 95.5 /100 | #121 | Exceptional 95.4% |
| Immigrants | Kuwait | 95.5 /100 | #122 | Exceptional 95.4% |
| Kiowa | 95.3 /100 | #123 | Exceptional 95.4% |
Demographics Similar to Cubans by 9th Grade
In terms of 9th grade, the demographic groups most similar to Cubans are Sri Lankan (93.2%, a difference of 0.0%), Immigrants from Laos (93.2%, a difference of 0.020%), Immigrants from Burma/Myanmar (93.1%, a difference of 0.020%), Indonesian (93.1%, a difference of 0.020%), and British West Indian (93.2%, a difference of 0.030%).
| Demographics | Rating | Rank | 9th Grade |
| Immigrants | St. Vincent and the Grenadines | 0.0 /100 | #287 | Tragic 93.4% |
| Immigrants | South Eastern Asia | 0.0 /100 | #288 | Tragic 93.3% |
| Immigrants | West Indies | 0.0 /100 | #289 | Tragic 93.3% |
| Pennsylvania Germans | 0.0 /100 | #290 | Tragic 93.3% |
| British West Indians | 0.0 /100 | #291 | Tragic 93.2% |
| Immigrants | Laos | 0.0 /100 | #292 | Tragic 93.2% |
| Sri Lankans | 0.0 /100 | #293 | Tragic 93.2% |
| Cubans | 0.0 /100 | #294 | Tragic 93.2% |
| Immigrants | Burma/Myanmar | 0.0 /100 | #295 | Tragic 93.1% |
| Indonesians | 0.0 /100 | #296 | Tragic 93.1% |
| Fijians | 0.0 /100 | #297 | Tragic 93.1% |
| Haitians | 0.0 /100 | #298 | Tragic 93.1% |
| Immigrants | Grenada | 0.0 /100 | #299 | Tragic 93.0% |
| Yaqui | 0.0 /100 | #300 | Tragic 92.9% |
| Immigrants | Haiti | 0.0 /100 | #301 | Tragic 92.7% |