Korean vs Yup'ik 4th Grade
COMPARE
Korean
Yup'ik
4th Grade
4th Grade Comparison
Koreans
Yup'ik
97.1%
4TH GRADE
1.3/ 100
METRIC RATING
244th/ 347
METRIC RANK
98.5%
4TH GRADE
100.0/ 100
METRIC RATING
5th/ 347
METRIC RANK
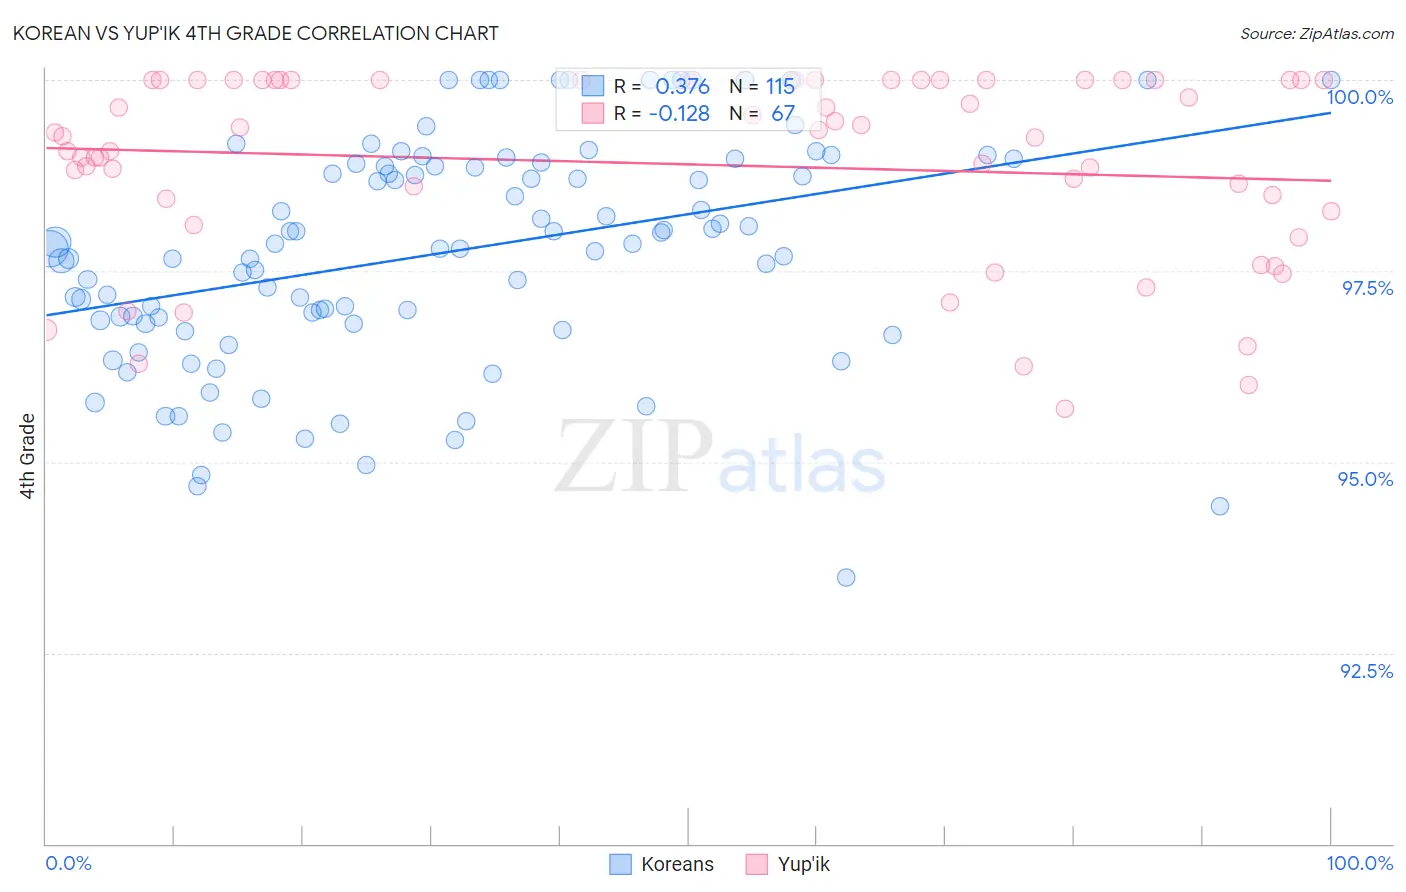
Korean vs Yup'ik 4th Grade Correlation Chart
The statistical analysis conducted on geographies consisting of 510,939,806 people shows a mild positive correlation between the proportion of Koreans and percentage of population with at least 4th grade education in the United States with a correlation coefficient (R) of 0.376 and weighted average of 97.1%. Similarly, the statistical analysis conducted on geographies consisting of 39,964,464 people shows a poor negative correlation between the proportion of Yup'ik and percentage of population with at least 4th grade education in the United States with a correlation coefficient (R) of -0.128 and weighted average of 98.5%, a difference of 1.5%.
4th Grade Correlation Summary
| Measurement | Korean | Yup'ik |
| Minimum | 93.5% | 95.7% |
| Maximum | 100.0% | 100.0% |
| Range | 6.5% | 4.3% |
| Mean | 97.7% | 98.9% |
| Median | 97.8% | 99.3% |
| Interquartile 25% (IQ1) | 96.8% | 98.3% |
| Interquartile 75% (IQ3) | 98.9% | 100.0% |
| Interquartile Range (IQR) | 2.1% | 1.7% |
| Standard Deviation (Sample) | 1.5% | 1.2% |
| Standard Deviation (Population) | 1.5% | 1.2% |
Similar Demographics by 4th Grade
Demographics Similar to Koreans by 4th Grade
In terms of 4th grade, the demographic groups most similar to Koreans are Immigrants from Eastern Africa (97.1%, a difference of 0.0%), Immigrants from Uruguay (97.1%, a difference of 0.0%), Ethiopian (97.1%, a difference of 0.0%), Asian (97.1%, a difference of 0.010%), and U.S. Virgin Islander (97.1%, a difference of 0.010%).
| Demographics | Rating | Rank | 4th Grade |
| Immigrants | Costa Rica | 2.0 /100 | #237 | Tragic 97.2% |
| Indians (Asian) | 1.9 /100 | #238 | Tragic 97.2% |
| Nigerians | 1.8 /100 | #239 | Tragic 97.1% |
| Colombians | 1.6 /100 | #240 | Tragic 97.1% |
| Immigrants | Indonesia | 1.5 /100 | #241 | Tragic 97.1% |
| Asians | 1.4 /100 | #242 | Tragic 97.1% |
| U.S. Virgin Islanders | 1.4 /100 | #243 | Tragic 97.1% |
| Koreans | 1.3 /100 | #244 | Tragic 97.1% |
| Immigrants | Eastern Africa | 1.2 /100 | #245 | Tragic 97.1% |
| Immigrants | Uruguay | 1.2 /100 | #246 | Tragic 97.1% |
| Ethiopians | 1.2 /100 | #247 | Tragic 97.1% |
| Immigrants | Asia | 1.2 /100 | #248 | Tragic 97.1% |
| Immigrants | Africa | 1.0 /100 | #249 | Tragic 97.1% |
| Immigrants | Senegal | 0.9 /100 | #250 | Tragic 97.1% |
| South Americans | 0.8 /100 | #251 | Tragic 97.1% |
Demographics Similar to Yup'ik by 4th Grade
In terms of 4th grade, the demographic groups most similar to Yup'ik are Inupiat (98.6%, a difference of 0.030%), Norwegian (98.5%, a difference of 0.030%), Slovak (98.5%, a difference of 0.050%), German (98.5%, a difference of 0.050%), and Tsimshian (98.6%, a difference of 0.090%).
| Demographics | Rating | Rank | 4th Grade |
| Crow | 100.0 /100 | #1 | Exceptional 99.6% |
| Welsh | 100.0 /100 | #2 | Exceptional 98.7% |
| Tsimshian | 100.0 /100 | #3 | Exceptional 98.6% |
| Inupiat | 100.0 /100 | #4 | Exceptional 98.6% |
| Yup'ik | 100.0 /100 | #5 | Exceptional 98.5% |
| Norwegians | 100.0 /100 | #6 | Exceptional 98.5% |
| Slovaks | 100.0 /100 | #7 | Exceptional 98.5% |
| Germans | 100.0 /100 | #8 | Exceptional 98.5% |
| Slovenes | 100.0 /100 | #9 | Exceptional 98.4% |
| Alaskan Athabascans | 100.0 /100 | #10 | Exceptional 98.4% |
| English | 100.0 /100 | #11 | Exceptional 98.4% |
| Tlingit-Haida | 100.0 /100 | #12 | Exceptional 98.4% |
| Swedes | 100.0 /100 | #13 | Exceptional 98.4% |
| Carpatho Rusyns | 100.0 /100 | #14 | Exceptional 98.4% |
| Dutch | 100.0 /100 | #15 | Exceptional 98.4% |