Immigrants from Panama vs Serbian Nursery School
COMPARE
Immigrants from Panama
Serbian
Nursery School
Nursery School Comparison
Immigrants from Panama
Serbians
97.8%
NURSERY SCHOOL
5.3/ 100
METRIC RATING
218th/ 347
METRIC RANK
98.4%
NURSERY SCHOOL
99.6/ 100
METRIC RATING
71st/ 347
METRIC RANK
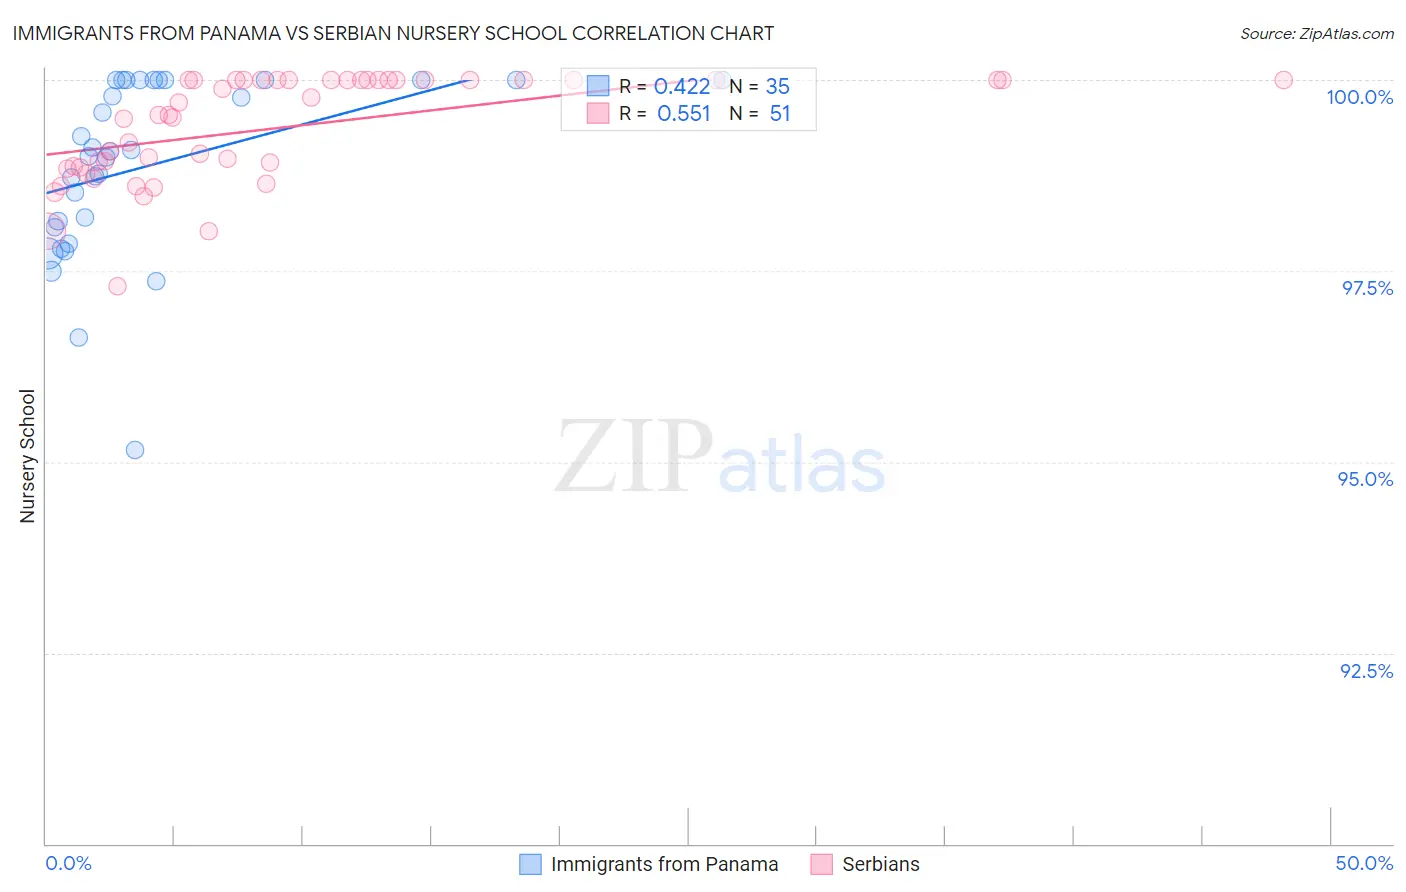
Immigrants from Panama vs Serbian Nursery School Correlation Chart
The statistical analysis conducted on geographies consisting of 221,182,871 people shows a moderate positive correlation between the proportion of Immigrants from Panama and percentage of population with at least nursery school education in the United States with a correlation coefficient (R) of 0.422 and weighted average of 97.8%. Similarly, the statistical analysis conducted on geographies consisting of 267,642,942 people shows a substantial positive correlation between the proportion of Serbians and percentage of population with at least nursery school education in the United States with a correlation coefficient (R) of 0.551 and weighted average of 98.4%, a difference of 0.64%.
Nursery School Correlation Summary
| Measurement | Immigrants from Panama | Serbian |
| Minimum | 95.1% | 97.3% |
| Maximum | 100.0% | 100.0% |
| Range | 4.9% | 2.7% |
| Mean | 98.9% | 99.4% |
| Median | 99.1% | 99.5% |
| Interquartile 25% (IQ1) | 98.1% | 98.8% |
| Interquartile 75% (IQ3) | 100.0% | 100.0% |
| Interquartile Range (IQR) | 1.9% | 1.2% |
| Standard Deviation (Sample) | 1.2% | 0.69% |
| Standard Deviation (Population) | 1.1% | 0.68% |
Similar Demographics by Nursery School
Demographics Similar to Immigrants from Panama by Nursery School
In terms of nursery school, the demographic groups most similar to Immigrants from Panama are Immigrants from Morocco (97.8%, a difference of 0.0%), Samoan (97.8%, a difference of 0.010%), Uruguayan (97.8%, a difference of 0.020%), Immigrants from Zaire (97.8%, a difference of 0.020%), and Tongan (97.8%, a difference of 0.020%).
| Demographics | Rating | Rank | Nursery School |
| Laotians | 9.8 /100 | #211 | Tragic 97.8% |
| Immigrants | Bahamas | 8.6 /100 | #212 | Tragic 97.8% |
| Moroccans | 8.3 /100 | #213 | Tragic 97.8% |
| South American Indians | 8.0 /100 | #214 | Tragic 97.8% |
| Bahamians | 7.4 /100 | #215 | Tragic 97.8% |
| Uruguayans | 7.1 /100 | #216 | Tragic 97.8% |
| Samoans | 6.3 /100 | #217 | Tragic 97.8% |
| Immigrants | Panama | 5.3 /100 | #218 | Tragic 97.8% |
| Immigrants | Morocco | 5.1 /100 | #219 | Tragic 97.8% |
| Immigrants | Zaire | 4.4 /100 | #220 | Tragic 97.8% |
| Tongans | 4.3 /100 | #221 | Tragic 97.8% |
| Immigrants | Syria | 4.0 /100 | #222 | Tragic 97.7% |
| Immigrants | Sudan | 3.9 /100 | #223 | Tragic 97.7% |
| Immigrants | Nepal | 3.6 /100 | #224 | Tragic 97.7% |
| Immigrants | Costa Rica | 3.5 /100 | #225 | Tragic 97.7% |
Demographics Similar to Serbians by Nursery School
In terms of nursery school, the demographic groups most similar to Serbians are Russian (98.4%, a difference of 0.0%), Immigrants from Austria (98.4%, a difference of 0.0%), Cheyenne (98.4%, a difference of 0.0%), Chickasaw (98.4%, a difference of 0.0%), and Canadian (98.4%, a difference of 0.010%).
| Demographics | Rating | Rank | Nursery School |
| Greeks | 99.7 /100 | #64 | Exceptional 98.4% |
| Maltese | 99.7 /100 | #65 | Exceptional 98.4% |
| Canadians | 99.7 /100 | #66 | Exceptional 98.4% |
| Immigrants | Northern Europe | 99.6 /100 | #67 | Exceptional 98.4% |
| Russians | 99.6 /100 | #68 | Exceptional 98.4% |
| Immigrants | Austria | 99.6 /100 | #69 | Exceptional 98.4% |
| Cheyenne | 99.6 /100 | #70 | Exceptional 98.4% |
| Serbians | 99.6 /100 | #71 | Exceptional 98.4% |
| Chickasaw | 99.6 /100 | #72 | Exceptional 98.4% |
| Cajuns | 99.4 /100 | #73 | Exceptional 98.4% |
| Immigrants | Netherlands | 99.4 /100 | #74 | Exceptional 98.4% |
| Cherokee | 99.3 /100 | #75 | Exceptional 98.3% |
| Immigrants | England | 99.3 /100 | #76 | Exceptional 98.3% |
| Immigrants | Lithuania | 99.3 /100 | #77 | Exceptional 98.3% |
| Delaware | 99.3 /100 | #78 | Exceptional 98.3% |