Immigrants from Japan vs Immigrants from Dominica 7th Grade
COMPARE
Immigrants from Japan
Immigrants from Dominica
7th Grade
7th Grade Comparison
Immigrants from Japan
Immigrants from Dominica
96.5%
7TH GRADE
95.5/ 100
METRIC RATING
118th/ 347
METRIC RANK
94.5%
7TH GRADE
0.0/ 100
METRIC RATING
301st/ 347
METRIC RANK
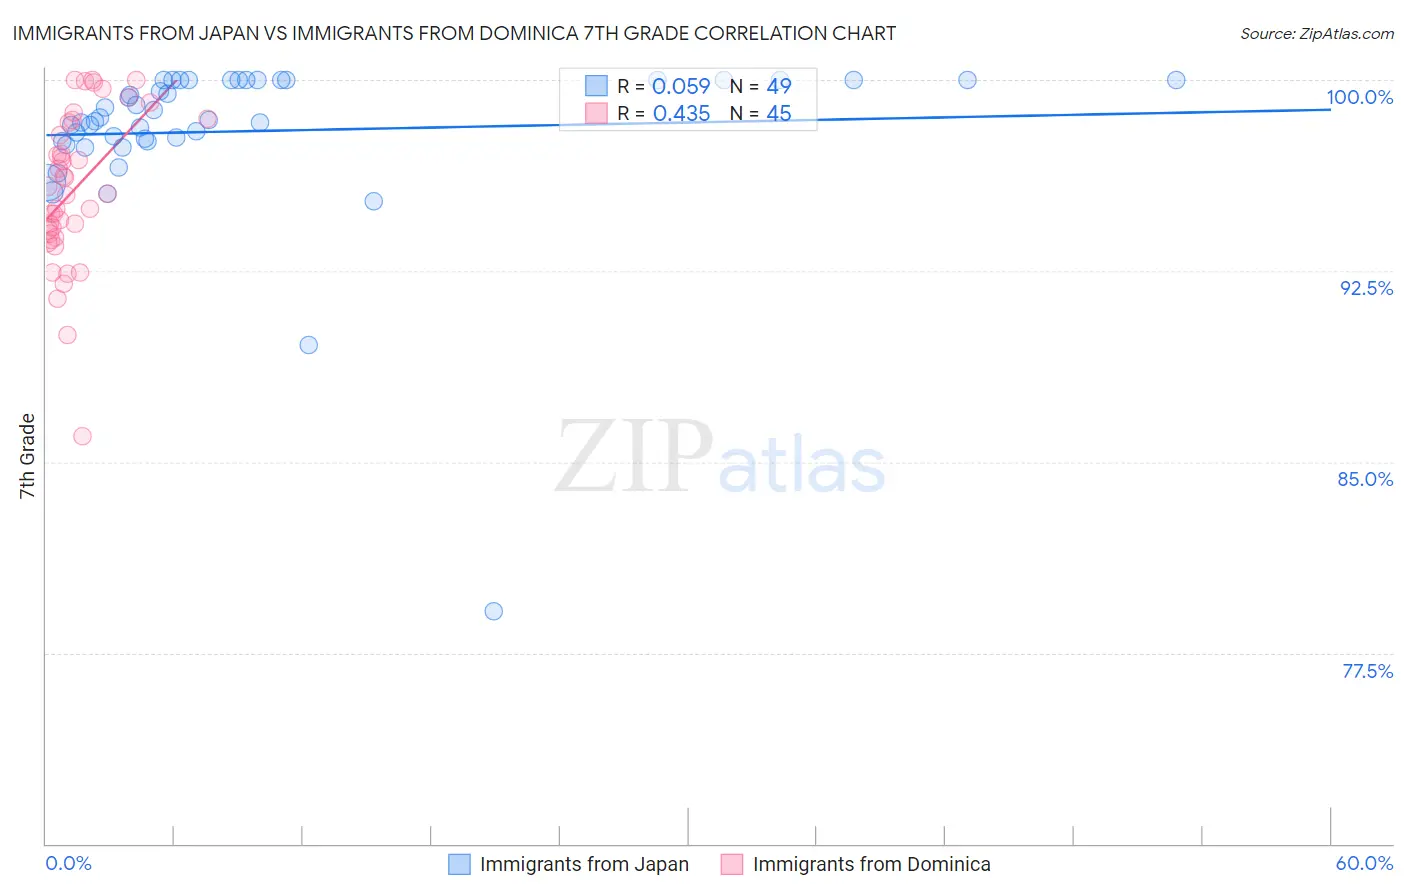
Immigrants from Japan vs Immigrants from Dominica 7th Grade Correlation Chart
The statistical analysis conducted on geographies consisting of 340,148,942 people shows a slight positive correlation between the proportion of Immigrants from Japan and percentage of population with at least 7th grade education in the United States with a correlation coefficient (R) of 0.059 and weighted average of 96.5%. Similarly, the statistical analysis conducted on geographies consisting of 83,794,115 people shows a moderate positive correlation between the proportion of Immigrants from Dominica and percentage of population with at least 7th grade education in the United States with a correlation coefficient (R) of 0.435 and weighted average of 94.5%, a difference of 2.1%.
7th Grade Correlation Summary
| Measurement | Immigrants from Japan | Immigrants from Dominica |
| Minimum | 79.1% | 86.0% |
| Maximum | 100.0% | 100.0% |
| Range | 20.9% | 14.0% |
| Mean | 98.0% | 95.7% |
| Median | 98.4% | 95.5% |
| Interquartile 25% (IQ1) | 97.6% | 93.9% |
| Interquartile 75% (IQ3) | 100.0% | 98.4% |
| Interquartile Range (IQR) | 2.4% | 4.5% |
| Standard Deviation (Sample) | 3.3% | 3.0% |
| Standard Deviation (Population) | 3.3% | 3.0% |
Similar Demographics by 7th Grade
Demographics Similar to Immigrants from Japan by 7th Grade
In terms of 7th grade, the demographic groups most similar to Immigrants from Japan are Immigrants from Moldova (96.5%, a difference of 0.010%), Immigrants from Norway (96.5%, a difference of 0.010%), Immigrants from Croatia (96.5%, a difference of 0.010%), Cheyenne (96.5%, a difference of 0.020%), and Immigrants from Europe (96.5%, a difference of 0.020%).
| Demographics | Rating | Rank | 7th Grade |
| Immigrants | Latvia | 97.4 /100 | #111 | Exceptional 96.6% |
| Immigrants | Nonimmigrants | 97.0 /100 | #112 | Exceptional 96.5% |
| Pueblo | 96.8 /100 | #113 | Exceptional 96.5% |
| Immigrants | Zimbabwe | 96.6 /100 | #114 | Exceptional 96.5% |
| Choctaw | 96.6 /100 | #115 | Exceptional 96.5% |
| Syrians | 96.6 /100 | #116 | Exceptional 96.5% |
| Immigrants | Moldova | 95.7 /100 | #117 | Exceptional 96.5% |
| Immigrants | Japan | 95.5 /100 | #118 | Exceptional 96.5% |
| Immigrants | Norway | 95.2 /100 | #119 | Exceptional 96.5% |
| Immigrants | Croatia | 95.0 /100 | #120 | Exceptional 96.5% |
| Cheyenne | 94.9 /100 | #121 | Exceptional 96.5% |
| Immigrants | Europe | 94.8 /100 | #122 | Exceptional 96.5% |
| Immigrants | France | 94.7 /100 | #123 | Exceptional 96.5% |
| Immigrants | Switzerland | 94.5 /100 | #124 | Exceptional 96.5% |
| Immigrants | Bulgaria | 94.0 /100 | #125 | Exceptional 96.4% |
Demographics Similar to Immigrants from Dominica by 7th Grade
In terms of 7th grade, the demographic groups most similar to Immigrants from Dominica are Immigrants from Laos (94.5%, a difference of 0.0%), Immigrants from Burma/Myanmar (94.5%, a difference of 0.030%), Indonesian (94.5%, a difference of 0.070%), Bangladeshi (94.5%, a difference of 0.070%), and Immigrants from South Eastern Asia (94.5%, a difference of 0.080%).
| Demographics | Rating | Rank | 7th Grade |
| Haitians | 0.0 /100 | #294 | Tragic 94.7% |
| Yaqui | 0.0 /100 | #295 | Tragic 94.6% |
| Cubans | 0.0 /100 | #296 | Tragic 94.6% |
| Immigrants | South Eastern Asia | 0.0 /100 | #297 | Tragic 94.5% |
| Indonesians | 0.0 /100 | #298 | Tragic 94.5% |
| Bangladeshis | 0.0 /100 | #299 | Tragic 94.5% |
| Immigrants | Burma/Myanmar | 0.0 /100 | #300 | Tragic 94.5% |
| Immigrants | Dominica | 0.0 /100 | #301 | Tragic 94.5% |
| Immigrants | Laos | 0.0 /100 | #302 | Tragic 94.5% |
| Sri Lankans | 0.0 /100 | #303 | Tragic 94.4% |
| Immigrants | Haiti | 0.0 /100 | #304 | Tragic 94.3% |
| Guyanese | 0.0 /100 | #305 | Tragic 94.3% |
| Immigrants | Guyana | 0.0 /100 | #306 | Tragic 94.2% |
| Immigrants | Portugal | 0.0 /100 | #307 | Tragic 94.2% |
| Cape Verdeans | 0.0 /100 | #308 | Tragic 94.1% |