Immigrants from Japan vs Swedish 7th Grade
COMPARE
Immigrants from Japan
Swedish
7th Grade
7th Grade Comparison
Immigrants from Japan
Swedes
96.5%
7TH GRADE
95.5/ 100
METRIC RATING
118th/ 347
METRIC RANK
97.6%
7TH GRADE
100.0/ 100
METRIC RATING
13th/ 347
METRIC RANK
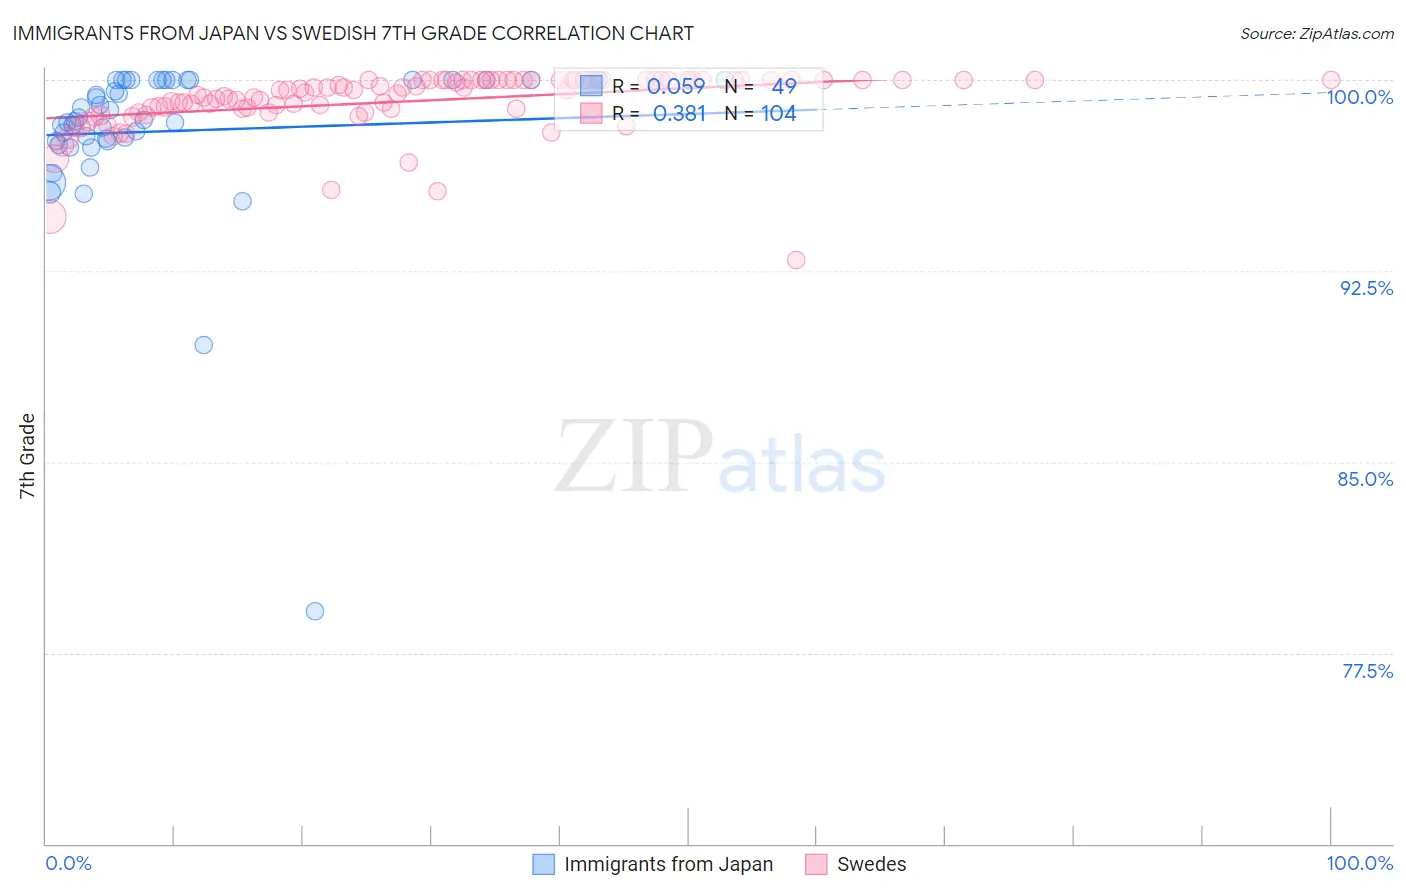
Immigrants from Japan vs Swedish 7th Grade Correlation Chart
The statistical analysis conducted on geographies consisting of 340,148,942 people shows a slight positive correlation between the proportion of Immigrants from Japan and percentage of population with at least 7th grade education in the United States with a correlation coefficient (R) of 0.059 and weighted average of 96.5%. Similarly, the statistical analysis conducted on geographies consisting of 539,231,492 people shows a mild positive correlation between the proportion of Swedes and percentage of population with at least 7th grade education in the United States with a correlation coefficient (R) of 0.381 and weighted average of 97.6%, a difference of 1.1%.
7th Grade Correlation Summary
| Measurement | Immigrants from Japan | Swedish |
| Minimum | 79.1% | 92.9% |
| Maximum | 100.0% | 100.0% |
| Range | 20.9% | 7.1% |
| Mean | 98.0% | 99.2% |
| Median | 98.4% | 99.6% |
| Interquartile 25% (IQ1) | 97.6% | 98.9% |
| Interquartile 75% (IQ3) | 100.0% | 100.0% |
| Interquartile Range (IQR) | 2.4% | 1.1% |
| Standard Deviation (Sample) | 3.3% | 1.2% |
| Standard Deviation (Population) | 3.3% | 1.2% |
Similar Demographics by 7th Grade
Demographics Similar to Immigrants from Japan by 7th Grade
In terms of 7th grade, the demographic groups most similar to Immigrants from Japan are Immigrants from Moldova (96.5%, a difference of 0.010%), Immigrants from Norway (96.5%, a difference of 0.010%), Immigrants from Croatia (96.5%, a difference of 0.010%), Cheyenne (96.5%, a difference of 0.020%), and Immigrants from Europe (96.5%, a difference of 0.020%).
| Demographics | Rating | Rank | 7th Grade |
| Immigrants | Latvia | 97.4 /100 | #111 | Exceptional 96.6% |
| Immigrants | Nonimmigrants | 97.0 /100 | #112 | Exceptional 96.5% |
| Pueblo | 96.8 /100 | #113 | Exceptional 96.5% |
| Immigrants | Zimbabwe | 96.6 /100 | #114 | Exceptional 96.5% |
| Choctaw | 96.6 /100 | #115 | Exceptional 96.5% |
| Syrians | 96.6 /100 | #116 | Exceptional 96.5% |
| Immigrants | Moldova | 95.7 /100 | #117 | Exceptional 96.5% |
| Immigrants | Japan | 95.5 /100 | #118 | Exceptional 96.5% |
| Immigrants | Norway | 95.2 /100 | #119 | Exceptional 96.5% |
| Immigrants | Croatia | 95.0 /100 | #120 | Exceptional 96.5% |
| Cheyenne | 94.9 /100 | #121 | Exceptional 96.5% |
| Immigrants | Europe | 94.8 /100 | #122 | Exceptional 96.5% |
| Immigrants | France | 94.7 /100 | #123 | Exceptional 96.5% |
| Immigrants | Switzerland | 94.5 /100 | #124 | Exceptional 96.5% |
| Immigrants | Bulgaria | 94.0 /100 | #125 | Exceptional 96.4% |
Demographics Similar to Swedes by 7th Grade
In terms of 7th grade, the demographic groups most similar to Swedes are Pennsylvania German (97.6%, a difference of 0.010%), English (97.6%, a difference of 0.020%), Polish (97.6%, a difference of 0.030%), Alaskan Athabascan (97.6%, a difference of 0.040%), and Slovene (97.6%, a difference of 0.050%).
| Demographics | Rating | Rank | 7th Grade |
| Tsimshian | 100.0 /100 | #6 | Exceptional 97.8% |
| Norwegians | 100.0 /100 | #7 | Exceptional 97.8% |
| Slovaks | 100.0 /100 | #8 | Exceptional 97.8% |
| Germans | 100.0 /100 | #9 | Exceptional 97.7% |
| Slovenes | 100.0 /100 | #10 | Exceptional 97.6% |
| Alaskan Athabascans | 100.0 /100 | #11 | Exceptional 97.6% |
| Poles | 100.0 /100 | #12 | Exceptional 97.6% |
| Swedes | 100.0 /100 | #13 | Exceptional 97.6% |
| Pennsylvania Germans | 100.0 /100 | #14 | Exceptional 97.6% |
| English | 100.0 /100 | #15 | Exceptional 97.6% |
| Irish | 100.0 /100 | #16 | Exceptional 97.5% |
| Scottish | 100.0 /100 | #17 | Exceptional 97.5% |
| Tlingit-Haida | 100.0 /100 | #18 | Exceptional 97.5% |
| Lithuanians | 100.0 /100 | #19 | Exceptional 97.5% |
| Yup'ik | 100.0 /100 | #20 | Exceptional 97.4% |