Immigrants from Eastern Europe vs Immigrants from Philippines 1st Grade
COMPARE
Immigrants from Eastern Europe
Immigrants from Philippines
1st Grade
1st Grade Comparison
Immigrants from Eastern Europe
Immigrants from Philippines
97.9%
1ST GRADE
58.9/ 100
METRIC RATING
162nd/ 347
METRIC RANK
97.4%
1ST GRADE
0.1/ 100
METRIC RATING
276th/ 347
METRIC RANK
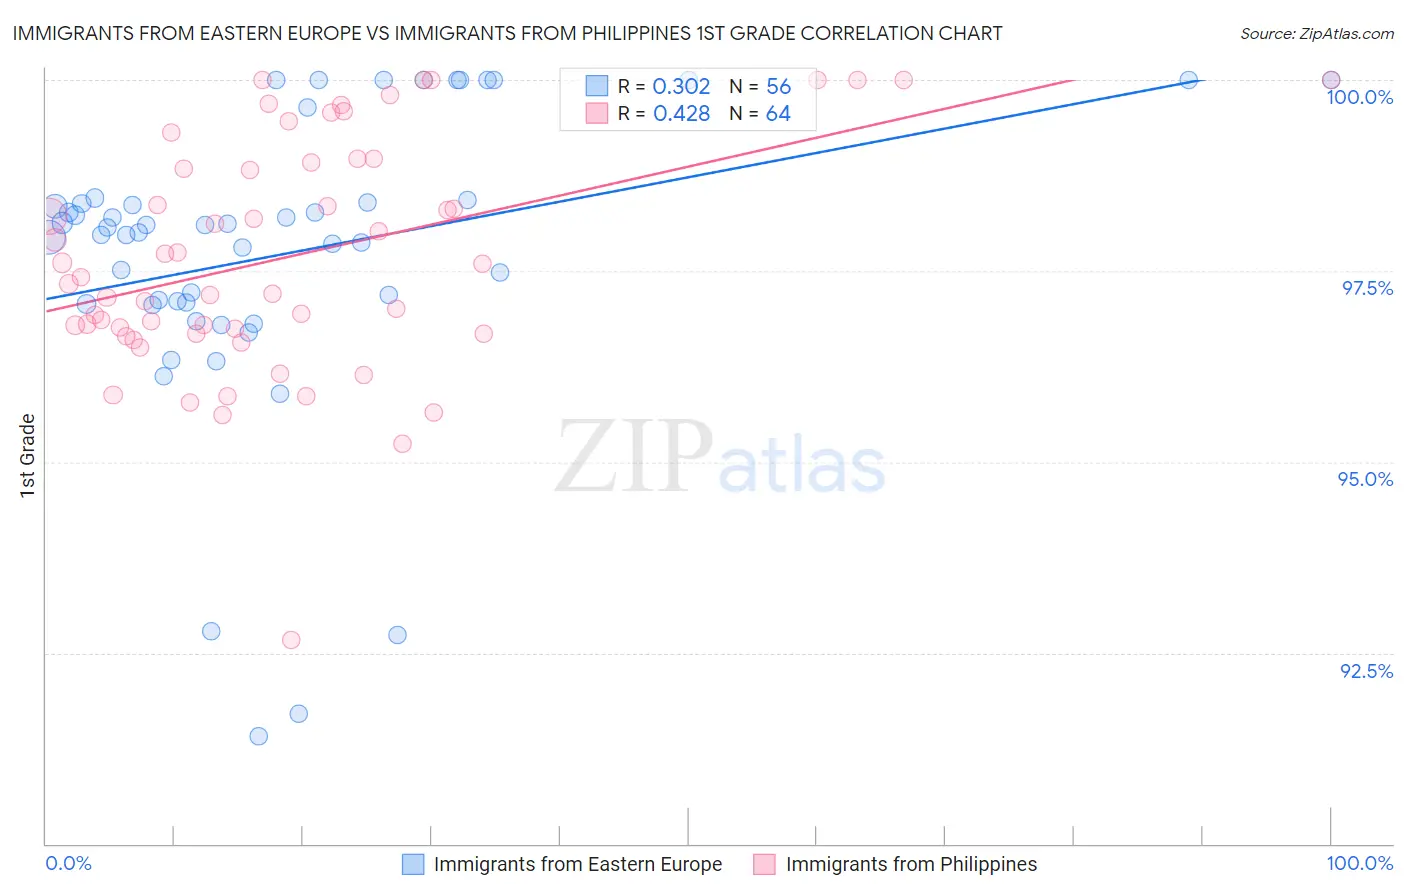
Immigrants from Eastern Europe vs Immigrants from Philippines 1st Grade Correlation Chart
The statistical analysis conducted on geographies consisting of 475,879,420 people shows a mild positive correlation between the proportion of Immigrants from Eastern Europe and percentage of population with at least 1st grade education in the United States with a correlation coefficient (R) of 0.302 and weighted average of 97.9%. Similarly, the statistical analysis conducted on geographies consisting of 471,303,140 people shows a moderate positive correlation between the proportion of Immigrants from Philippines and percentage of population with at least 1st grade education in the United States with a correlation coefficient (R) of 0.428 and weighted average of 97.4%, a difference of 0.58%.
1st Grade Correlation Summary
| Measurement | Immigrants from Eastern Europe | Immigrants from Philippines |
| Minimum | 91.4% | 92.7% |
| Maximum | 100.0% | 100.0% |
| Range | 8.6% | 7.3% |
| Mean | 97.7% | 97.7% |
| Median | 98.0% | 97.5% |
| Interquartile 25% (IQ1) | 97.1% | 96.7% |
| Interquartile 75% (IQ3) | 98.4% | 98.9% |
| Interquartile Range (IQR) | 1.3% | 2.2% |
| Standard Deviation (Sample) | 1.9% | 1.5% |
| Standard Deviation (Population) | 1.9% | 1.5% |
Similar Demographics by 1st Grade
Demographics Similar to Immigrants from Eastern Europe by 1st Grade
In terms of 1st grade, the demographic groups most similar to Immigrants from Eastern Europe are Immigrants from Russia (97.9%, a difference of 0.0%), Immigrants from Italy (97.9%, a difference of 0.0%), Spanish American (97.9%, a difference of 0.0%), Brazilian (97.9%, a difference of 0.0%), and Ugandan (97.9%, a difference of 0.010%).
| Demographics | Rating | Rank | 1st Grade |
| Comanche | 66.9 /100 | #155 | Good 98.0% |
| Immigrants | South Central Asia | 66.2 /100 | #156 | Good 98.0% |
| Immigrants | North Macedonia | 65.3 /100 | #157 | Good 98.0% |
| Venezuelans | 64.7 /100 | #158 | Good 98.0% |
| French American Indians | 63.7 /100 | #159 | Good 98.0% |
| Immigrants | Russia | 59.2 /100 | #160 | Average 97.9% |
| Immigrants | Italy | 59.1 /100 | #161 | Average 97.9% |
| Immigrants | Eastern Europe | 58.9 /100 | #162 | Average 97.9% |
| Spanish Americans | 57.7 /100 | #163 | Average 97.9% |
| Brazilians | 57.6 /100 | #164 | Average 97.9% |
| Ugandans | 56.9 /100 | #165 | Average 97.9% |
| Navajo | 56.6 /100 | #166 | Average 97.9% |
| Bermudans | 56.3 /100 | #167 | Average 97.9% |
| Chileans | 55.6 /100 | #168 | Average 97.9% |
| Immigrants | Micronesia | 55.3 /100 | #169 | Average 97.9% |
Demographics Similar to Immigrants from Philippines by 1st Grade
In terms of 1st grade, the demographic groups most similar to Immigrants from Philippines are Immigrants from Western Africa (97.4%, a difference of 0.010%), Ghanaian (97.4%, a difference of 0.020%), Immigrants from China (97.4%, a difference of 0.020%), Immigrants from Uzbekistan (97.4%, a difference of 0.030%), and Immigrants from Ghana (97.4%, a difference of 0.030%).
| Demographics | Rating | Rank | 1st Grade |
| West Indians | 0.3 /100 | #269 | Tragic 97.5% |
| Immigrants | Jamaica | 0.2 /100 | #270 | Tragic 97.5% |
| Immigrants | Cameroon | 0.2 /100 | #271 | Tragic 97.4% |
| Immigrants | Peru | 0.2 /100 | #272 | Tragic 97.4% |
| Immigrants | Bolivia | 0.2 /100 | #273 | Tragic 97.4% |
| Ghanaians | 0.1 /100 | #274 | Tragic 97.4% |
| Immigrants | China | 0.1 /100 | #275 | Tragic 97.4% |
| Immigrants | Philippines | 0.1 /100 | #276 | Tragic 97.4% |
| Immigrants | Western Africa | 0.1 /100 | #277 | Tragic 97.4% |
| Immigrants | Uzbekistan | 0.1 /100 | #278 | Tragic 97.4% |
| Immigrants | Ghana | 0.1 /100 | #279 | Tragic 97.4% |
| Afghans | 0.1 /100 | #280 | Tragic 97.4% |
| Trinidadians and Tobagonians | 0.1 /100 | #281 | Tragic 97.3% |
| Barbadians | 0.1 /100 | #282 | Tragic 97.3% |
| Immigrants | West Indies | 0.0 /100 | #283 | Tragic 97.3% |