Immigrants from Japan vs Cape Verdean 1st Grade
COMPARE
Immigrants from Japan
Cape Verdean
1st Grade
1st Grade Comparison
Immigrants from Japan
Cape Verdeans
98.1%
1ST GRADE
93.7/ 100
METRIC RATING
125th/ 347
METRIC RANK
96.9%
1ST GRADE
0.0/ 100
METRIC RATING
312th/ 347
METRIC RANK
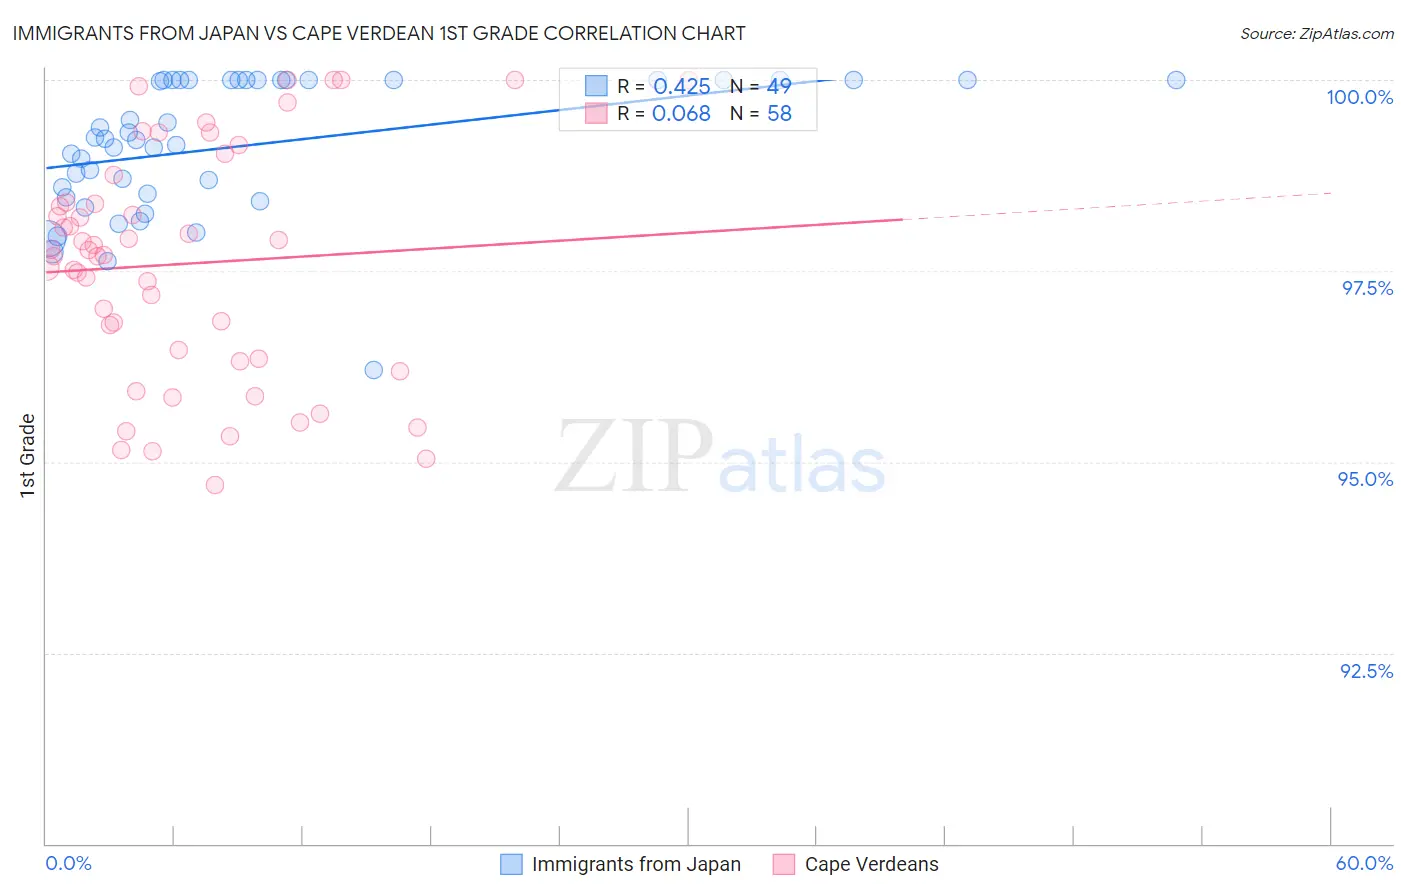
Immigrants from Japan vs Cape Verdean 1st Grade Correlation Chart
The statistical analysis conducted on geographies consisting of 340,149,128 people shows a moderate positive correlation between the proportion of Immigrants from Japan and percentage of population with at least 1st grade education in the United States with a correlation coefficient (R) of 0.425 and weighted average of 98.1%. Similarly, the statistical analysis conducted on geographies consisting of 107,537,955 people shows a slight positive correlation between the proportion of Cape Verdeans and percentage of population with at least 1st grade education in the United States with a correlation coefficient (R) of 0.068 and weighted average of 96.9%, a difference of 1.3%.
1st Grade Correlation Summary
| Measurement | Immigrants from Japan | Cape Verdean |
| Minimum | 96.2% | 94.7% |
| Maximum | 100.0% | 100.0% |
| Range | 3.8% | 5.3% |
| Mean | 99.1% | 97.6% |
| Median | 99.2% | 97.7% |
| Interquartile 25% (IQ1) | 98.5% | 96.4% |
| Interquartile 75% (IQ3) | 100.0% | 98.4% |
| Interquartile Range (IQR) | 1.5% | 2.0% |
| Standard Deviation (Sample) | 0.88% | 1.5% |
| Standard Deviation (Population) | 0.87% | 1.5% |
Similar Demographics by 1st Grade
Demographics Similar to Immigrants from Japan by 1st Grade
In terms of 1st grade, the demographic groups most similar to Immigrants from Japan are Immigrants from Zimbabwe (98.1%, a difference of 0.0%), Menominee (98.1%, a difference of 0.0%), Iroquois (98.1%, a difference of 0.0%), Syrian (98.1%, a difference of 0.0%), and Lebanese (98.1%, a difference of 0.0%).
| Demographics | Rating | Rank | 1st Grade |
| Immigrants | France | 95.5 /100 | #118 | Exceptional 98.2% |
| Thais | 94.7 /100 | #119 | Exceptional 98.1% |
| Okinawans | 94.5 /100 | #120 | Exceptional 98.1% |
| Immigrants | Zimbabwe | 94.0 /100 | #121 | Exceptional 98.1% |
| Menominee | 93.9 /100 | #122 | Exceptional 98.1% |
| Iroquois | 93.8 /100 | #123 | Exceptional 98.1% |
| Syrians | 93.7 /100 | #124 | Exceptional 98.1% |
| Immigrants | Japan | 93.7 /100 | #125 | Exceptional 98.1% |
| Lebanese | 93.5 /100 | #126 | Exceptional 98.1% |
| Immigrants | Saudi Arabia | 93.3 /100 | #127 | Exceptional 98.1% |
| Immigrants | Serbia | 92.2 /100 | #128 | Exceptional 98.1% |
| Seminole | 91.9 /100 | #129 | Exceptional 98.1% |
| Immigrants | Croatia | 91.4 /100 | #130 | Exceptional 98.1% |
| Spaniards | 91.2 /100 | #131 | Exceptional 98.1% |
| Cambodians | 90.9 /100 | #132 | Exceptional 98.1% |
Demographics Similar to Cape Verdeans by 1st Grade
In terms of 1st grade, the demographic groups most similar to Cape Verdeans are Sri Lankan (96.9%, a difference of 0.0%), Guyanese (96.9%, a difference of 0.010%), Honduran (96.9%, a difference of 0.020%), Hispanic or Latino (96.9%, a difference of 0.030%), and Immigrants from Haiti (96.9%, a difference of 0.030%).
| Demographics | Rating | Rank | 1st Grade |
| Ecuadorians | 0.0 /100 | #305 | Tragic 97.0% |
| Belizeans | 0.0 /100 | #306 | Tragic 96.9% |
| Immigrants | Somalia | 0.0 /100 | #307 | Tragic 96.9% |
| Hispanics or Latinos | 0.0 /100 | #308 | Tragic 96.9% |
| Immigrants | Haiti | 0.0 /100 | #309 | Tragic 96.9% |
| Immigrants | Azores | 0.0 /100 | #310 | Tragic 96.9% |
| Sri Lankans | 0.0 /100 | #311 | Tragic 96.9% |
| Cape Verdeans | 0.0 /100 | #312 | Tragic 96.9% |
| Guyanese | 0.0 /100 | #313 | Tragic 96.9% |
| Hondurans | 0.0 /100 | #314 | Tragic 96.9% |
| Immigrants | Belize | 0.0 /100 | #315 | Tragic 96.9% |
| Immigrants | Ecuador | 0.0 /100 | #316 | Tragic 96.9% |
| Immigrants | Nicaragua | 0.0 /100 | #317 | Tragic 96.9% |
| Immigrants | Laos | 0.0 /100 | #318 | Tragic 96.8% |
| Immigrants | Guyana | 0.0 /100 | #319 | Tragic 96.8% |