Immigrants from Japan vs Spanish American Indian 11th Grade
COMPARE
Immigrants from Japan
Spanish American Indian
11th Grade
11th Grade Comparison
Immigrants from Japan
Spanish American Indians
93.8%
11TH GRADE
99.7/ 100
METRIC RATING
72nd/ 347
METRIC RANK
84.7%
11TH GRADE
0.0/ 100
METRIC RATING
346th/ 347
METRIC RANK
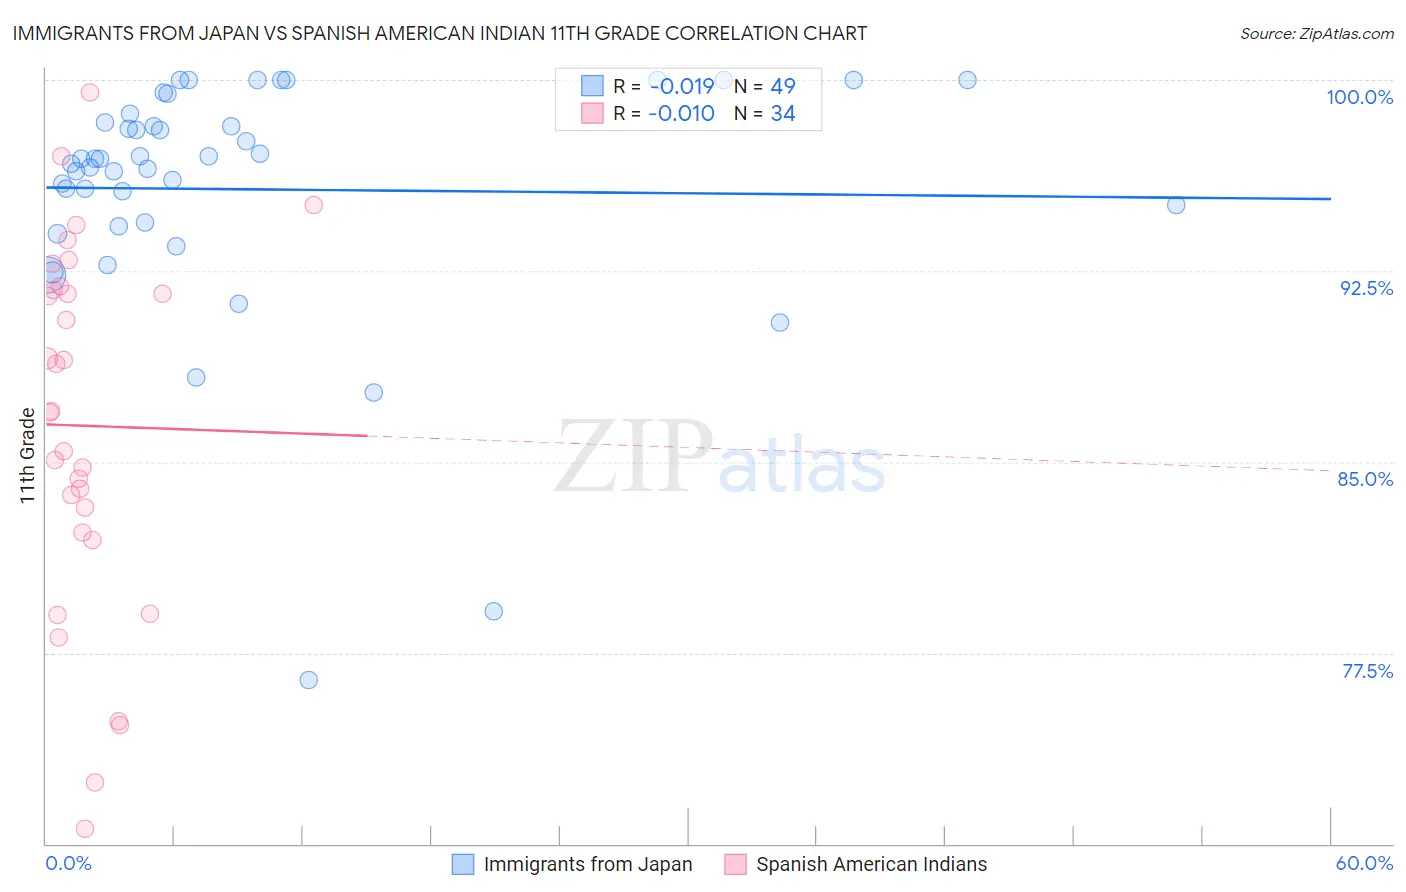
Immigrants from Japan vs Spanish American Indian 11th Grade Correlation Chart
The statistical analysis conducted on geographies consisting of 340,148,942 people shows no correlation between the proportion of Immigrants from Japan and percentage of population with at least 11th grade education in the United States with a correlation coefficient (R) of -0.019 and weighted average of 93.8%. Similarly, the statistical analysis conducted on geographies consisting of 73,147,813 people shows no correlation between the proportion of Spanish American Indians and percentage of population with at least 11th grade education in the United States with a correlation coefficient (R) of -0.010 and weighted average of 84.7%, a difference of 10.7%.
11th Grade Correlation Summary
| Measurement | Immigrants from Japan | Spanish American Indian |
| Minimum | 76.5% | 70.6% |
| Maximum | 100.0% | 99.5% |
| Range | 23.5% | 29.0% |
| Mean | 95.7% | 86.4% |
| Median | 96.9% | 87.0% |
| Interquartile 25% (IQ1) | 94.3% | 82.2% |
| Interquartile 75% (IQ3) | 98.5% | 91.7% |
| Interquartile Range (IQR) | 4.2% | 9.5% |
| Standard Deviation (Sample) | 4.8% | 7.2% |
| Standard Deviation (Population) | 4.8% | 7.1% |
Similar Demographics by 11th Grade
Demographics Similar to Immigrants from Japan by 11th Grade
In terms of 11th grade, the demographic groups most similar to Immigrants from Japan are Romanian (93.8%, a difference of 0.020%), Immigrants from Czechoslovakia (93.8%, a difference of 0.020%), Immigrants from South Africa (93.8%, a difference of 0.030%), Immigrants from England (93.8%, a difference of 0.040%), and Immigrants from Latvia (93.8%, a difference of 0.040%).
| Demographics | Rating | Rank | 11th Grade |
| Native Hawaiians | 99.8 /100 | #65 | Exceptional 93.9% |
| Alaskan Athabascans | 99.8 /100 | #66 | Exceptional 93.9% |
| Immigrants | Netherlands | 99.8 /100 | #67 | Exceptional 93.9% |
| Zimbabweans | 99.8 /100 | #68 | Exceptional 93.9% |
| Scotch-Irish | 99.8 /100 | #69 | Exceptional 93.9% |
| Immigrants | England | 99.7 /100 | #70 | Exceptional 93.8% |
| Immigrants | South Africa | 99.7 /100 | #71 | Exceptional 93.8% |
| Immigrants | Japan | 99.7 /100 | #72 | Exceptional 93.8% |
| Romanians | 99.6 /100 | #73 | Exceptional 93.8% |
| Immigrants | Czechoslovakia | 99.6 /100 | #74 | Exceptional 93.8% |
| Immigrants | Latvia | 99.6 /100 | #75 | Exceptional 93.8% |
| Celtics | 99.5 /100 | #76 | Exceptional 93.7% |
| Aleuts | 99.5 /100 | #77 | Exceptional 93.7% |
| Soviet Union | 99.5 /100 | #78 | Exceptional 93.7% |
| Immigrants | Denmark | 99.5 /100 | #79 | Exceptional 93.7% |
Demographics Similar to Spanish American Indians by 11th Grade
In terms of 11th grade, the demographic groups most similar to Spanish American Indians are Immigrants from Central America (84.9%, a difference of 0.24%), Yakama (85.0%, a difference of 0.27%), Immigrants from Mexico (84.5%, a difference of 0.30%), Immigrants from El Salvador (85.3%, a difference of 0.68%), and Immigrants from Guatemala (85.8%, a difference of 1.3%).
| Demographics | Rating | Rank | 11th Grade |
| Immigrants | Yemen | 0.0 /100 | #333 | Tragic 87.1% |
| Houma | 0.0 /100 | #334 | Tragic 87.0% |
| Central Americans | 0.0 /100 | #335 | Tragic 86.9% |
| Immigrants | Dominican Republic | 0.0 /100 | #336 | Tragic 86.9% |
| Immigrants | Honduras | 0.0 /100 | #337 | Tragic 86.9% |
| Immigrants | Latin America | 0.0 /100 | #338 | Tragic 86.8% |
| Guatemalans | 0.0 /100 | #339 | Tragic 86.4% |
| Salvadorans | 0.0 /100 | #340 | Tragic 86.2% |
| Mexicans | 0.0 /100 | #341 | Tragic 86.1% |
| Immigrants | Guatemala | 0.0 /100 | #342 | Tragic 85.8% |
| Immigrants | El Salvador | 0.0 /100 | #343 | Tragic 85.3% |
| Yakama | 0.0 /100 | #344 | Tragic 85.0% |
| Immigrants | Central America | 0.0 /100 | #345 | Tragic 84.9% |
| Spanish American Indians | 0.0 /100 | #346 | Tragic 84.7% |
| Immigrants | Mexico | 0.0 /100 | #347 | Tragic 84.5% |