Immigrants from Northern Europe vs Inupiat Bachelor's Degree
COMPARE
Immigrants from Northern Europe
Inupiat
Bachelor's Degree
Bachelor's Degree Comparison
Immigrants from Northern Europe
Inupiat
45.6%
BACHELOR'S DEGREE
100.0/ 100
METRIC RATING
33rd/ 347
METRIC RANK
25.8%
BACHELOR'S DEGREE
0.0/ 100
METRIC RATING
337th/ 347
METRIC RANK
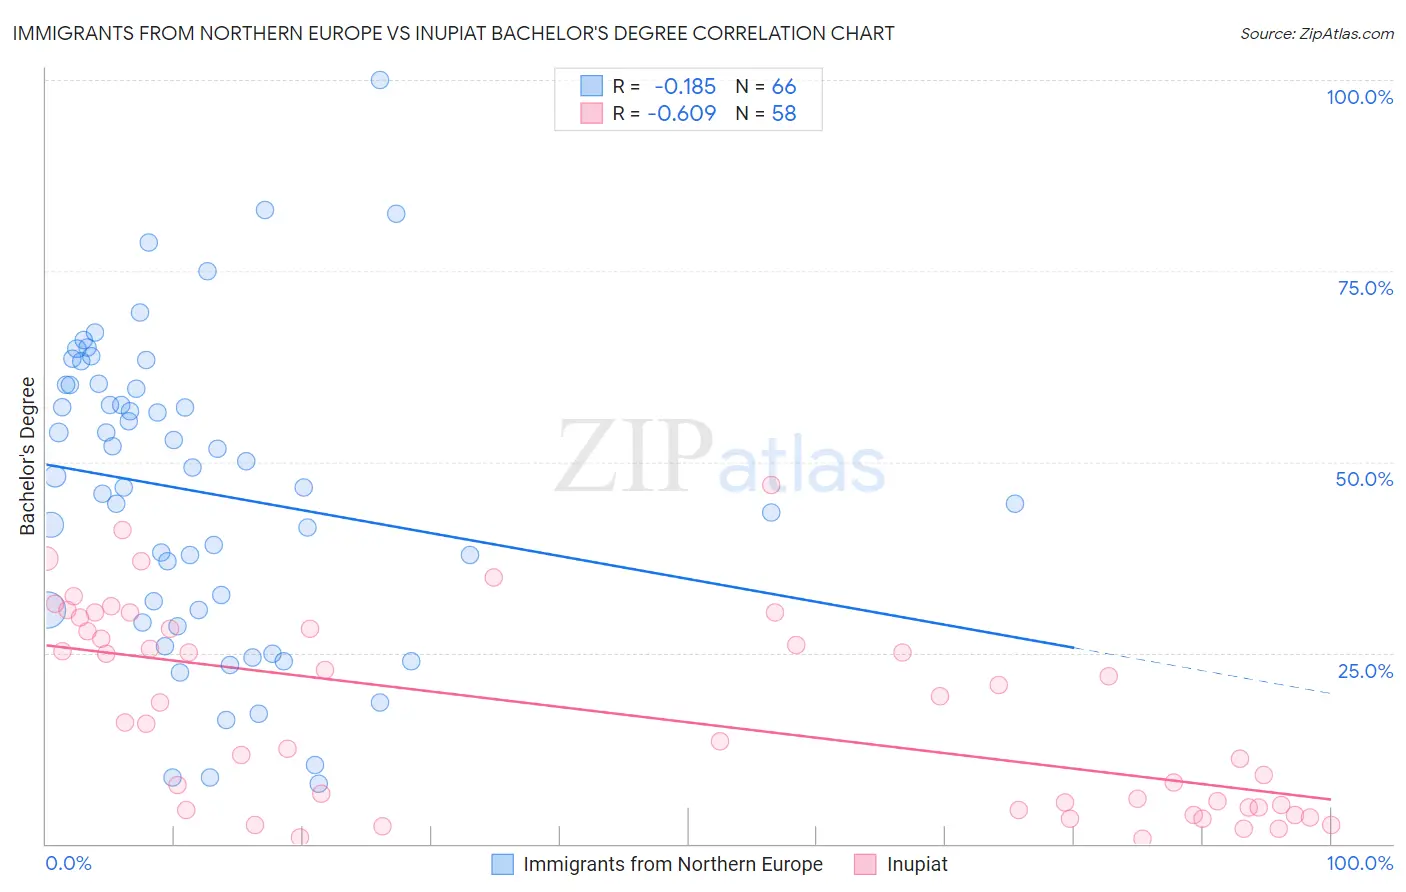
Immigrants from Northern Europe vs Inupiat Bachelor's Degree Correlation Chart
The statistical analysis conducted on geographies consisting of 477,184,497 people shows a poor negative correlation between the proportion of Immigrants from Northern Europe and percentage of population with at least bachelor's degree education in the United States with a correlation coefficient (R) of -0.185 and weighted average of 45.6%. Similarly, the statistical analysis conducted on geographies consisting of 96,347,168 people shows a significant negative correlation between the proportion of Inupiat and percentage of population with at least bachelor's degree education in the United States with a correlation coefficient (R) of -0.609 and weighted average of 25.8%, a difference of 76.8%.
Bachelor's Degree Correlation Summary
| Measurement | Immigrants from Northern Europe | Inupiat |
| Minimum | 7.8% | 0.66% |
| Maximum | 100.0% | 47.0% |
| Range | 92.2% | 46.4% |
| Mean | 46.0% | 17.1% |
| Median | 47.4% | 15.8% |
| Interquartile 25% (IQ1) | 30.6% | 4.7% |
| Interquartile 75% (IQ3) | 60.1% | 28.1% |
| Interquartile Range (IQR) | 29.5% | 23.4% |
| Standard Deviation (Sample) | 20.0% | 12.7% |
| Standard Deviation (Population) | 19.8% | 12.6% |
Similar Demographics by Bachelor's Degree
Demographics Similar to Immigrants from Northern Europe by Bachelor's Degree
In terms of bachelor's degree, the demographic groups most similar to Immigrants from Northern Europe are Immigrants from Denmark (45.4%, a difference of 0.45%), Immigrants from Russia (45.4%, a difference of 0.48%), Mongolian (45.4%, a difference of 0.50%), Russian (45.3%, a difference of 0.65%), and Immigrants from Turkey (46.0%, a difference of 0.70%).
| Demographics | Rating | Rank | Bachelor's Degree |
| Immigrants | Japan | 100.0 /100 | #26 | Exceptional 46.8% |
| Immigrants | France | 100.0 /100 | #27 | Exceptional 46.4% |
| Turks | 100.0 /100 | #28 | Exceptional 46.2% |
| Israelis | 100.0 /100 | #29 | Exceptional 46.1% |
| Immigrants | Sri Lanka | 100.0 /100 | #30 | Exceptional 46.1% |
| Latvians | 100.0 /100 | #31 | Exceptional 46.1% |
| Immigrants | Turkey | 100.0 /100 | #32 | Exceptional 46.0% |
| Immigrants | Northern Europe | 100.0 /100 | #33 | Exceptional 45.6% |
| Immigrants | Denmark | 100.0 /100 | #34 | Exceptional 45.4% |
| Immigrants | Russia | 100.0 /100 | #35 | Exceptional 45.4% |
| Mongolians | 100.0 /100 | #36 | Exceptional 45.4% |
| Russians | 100.0 /100 | #37 | Exceptional 45.3% |
| Bulgarians | 100.0 /100 | #38 | Exceptional 45.3% |
| Immigrants | Latvia | 100.0 /100 | #39 | Exceptional 45.1% |
| Immigrants | Belarus | 100.0 /100 | #40 | Exceptional 45.0% |
Demographics Similar to Inupiat by Bachelor's Degree
In terms of bachelor's degree, the demographic groups most similar to Inupiat are Pueblo (25.5%, a difference of 1.1%), Immigrants from Mexico (26.1%, a difference of 1.3%), Native/Alaskan (26.3%, a difference of 2.0%), Hopi (25.3%, a difference of 2.0%), and Arapaho (26.6%, a difference of 3.2%).
| Demographics | Rating | Rank | Bachelor's Degree |
| Spanish American Indians | 0.0 /100 | #330 | Tragic 27.5% |
| Immigrants | Azores | 0.0 /100 | #331 | Tragic 27.3% |
| Menominee | 0.0 /100 | #332 | Tragic 27.3% |
| Mexicans | 0.0 /100 | #333 | Tragic 27.1% |
| Arapaho | 0.0 /100 | #334 | Tragic 26.6% |
| Natives/Alaskans | 0.0 /100 | #335 | Tragic 26.3% |
| Immigrants | Mexico | 0.0 /100 | #336 | Tragic 26.1% |
| Inupiat | 0.0 /100 | #337 | Tragic 25.8% |
| Pueblo | 0.0 /100 | #338 | Tragic 25.5% |
| Hopi | 0.0 /100 | #339 | Tragic 25.3% |
| Lumbee | 0.0 /100 | #340 | Tragic 24.8% |
| Yuman | 0.0 /100 | #341 | Tragic 24.5% |
| Yakama | 0.0 /100 | #342 | Tragic 24.5% |
| Tohono O'odham | 0.0 /100 | #343 | Tragic 24.4% |
| Navajo | 0.0 /100 | #344 | Tragic 23.6% |