Immigrants from South America vs Paiute 11th Grade
COMPARE
Immigrants from South America
Paiute
11th Grade
11th Grade Comparison
Immigrants from South America
Paiute
91.4%
11TH GRADE
0.8/ 100
METRIC RATING
253rd/ 347
METRIC RANK
91.0%
11TH GRADE
0.1/ 100
METRIC RATING
273rd/ 347
METRIC RANK
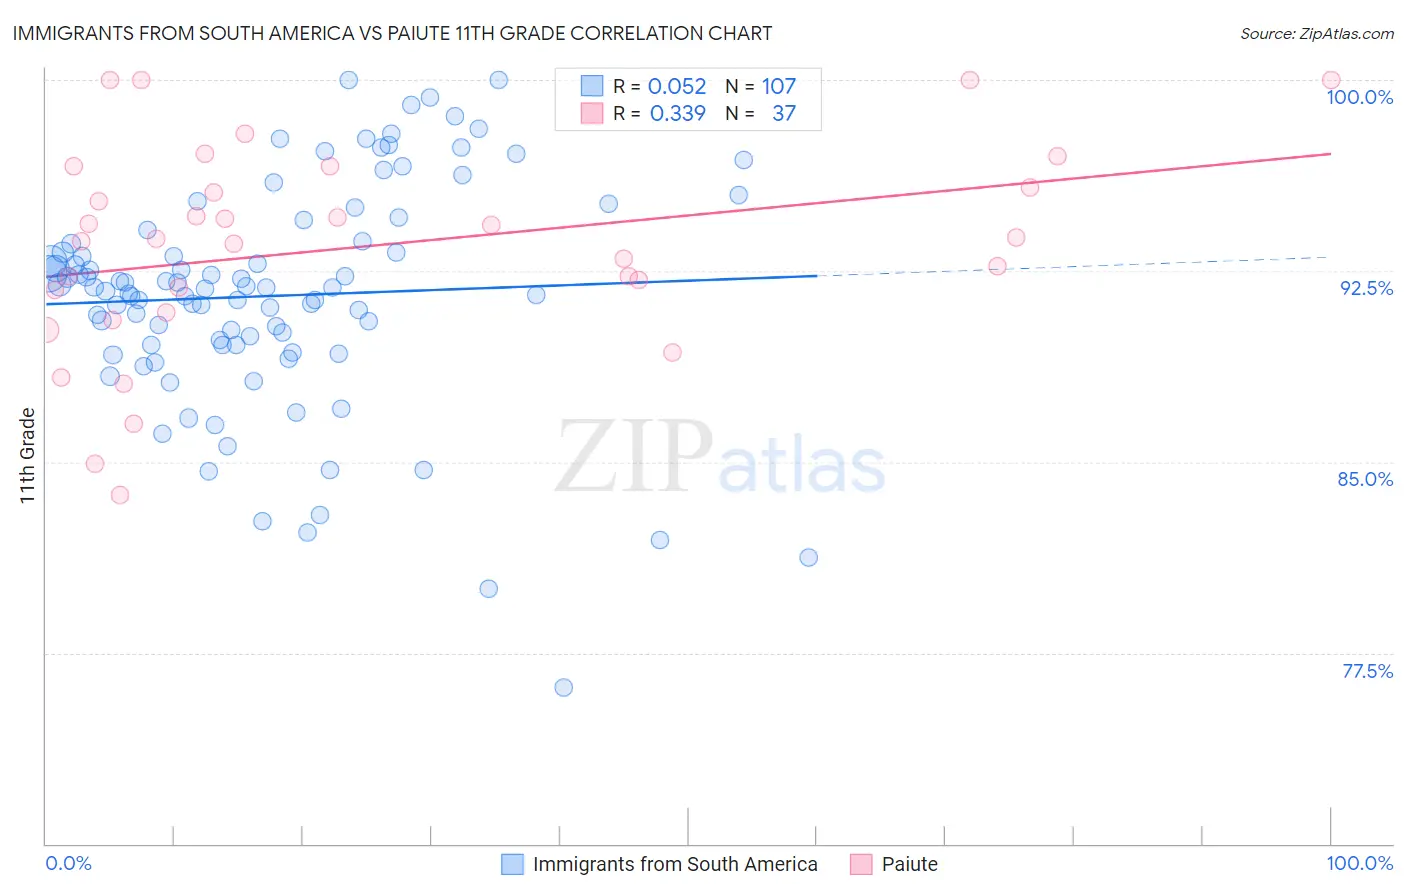
Immigrants from South America vs Paiute 11th Grade Correlation Chart
The statistical analysis conducted on geographies consisting of 486,312,594 people shows a slight positive correlation between the proportion of Immigrants from South America and percentage of population with at least 11th grade education in the United States with a correlation coefficient (R) of 0.052 and weighted average of 91.4%. Similarly, the statistical analysis conducted on geographies consisting of 58,403,520 people shows a mild positive correlation between the proportion of Paiute and percentage of population with at least 11th grade education in the United States with a correlation coefficient (R) of 0.339 and weighted average of 91.0%, a difference of 0.49%.
11th Grade Correlation Summary
| Measurement | Immigrants from South America | Paiute |
| Minimum | 76.1% | 83.7% |
| Maximum | 100.0% | 100.0% |
| Range | 23.9% | 16.3% |
| Mean | 91.5% | 93.4% |
| Median | 91.8% | 93.8% |
| Interquartile 25% (IQ1) | 89.6% | 91.3% |
| Interquartile 75% (IQ3) | 93.7% | 96.2% |
| Interquartile Range (IQR) | 4.1% | 4.9% |
| Standard Deviation (Sample) | 4.4% | 4.0% |
| Standard Deviation (Population) | 4.4% | 4.0% |
Demographics Similar to Immigrants from South America and Paiute by 11th Grade
In terms of 11th grade, the demographic groups most similar to Immigrants from South America are Immigrants from Eritrea (91.4%, a difference of 0.020%), Black/African American (91.4%, a difference of 0.020%), Immigrants from Senegal (91.4%, a difference of 0.030%), Cajun (91.4%, a difference of 0.040%), and Immigrants from Colombia (91.4%, a difference of 0.060%). Similarly, the demographic groups most similar to Paiute are Immigrants from Peru (91.0%, a difference of 0.050%), West Indian (91.0%, a difference of 0.050%), Trinidadian and Tobagonian (91.1%, a difference of 0.080%), Ute (91.1%, a difference of 0.11%), and U.S. Virgin Islander (91.1%, a difference of 0.14%).
| Demographics | Rating | Rank | 11th Grade |
| Immigrants | South America | 0.8 /100 | #253 | Tragic 91.4% |
| Immigrants | Eritrea | 0.7 /100 | #254 | Tragic 91.4% |
| Blacks/African Americans | 0.7 /100 | #255 | Tragic 91.4% |
| Immigrants | Senegal | 0.7 /100 | #256 | Tragic 91.4% |
| Cajuns | 0.7 /100 | #257 | Tragic 91.4% |
| Immigrants | Colombia | 0.6 /100 | #258 | Tragic 91.4% |
| Jamaicans | 0.6 /100 | #259 | Tragic 91.4% |
| Spanish Americans | 0.6 /100 | #260 | Tragic 91.4% |
| Taiwanese | 0.6 /100 | #261 | Tragic 91.3% |
| Immigrants | Uruguay | 0.5 /100 | #262 | Tragic 91.3% |
| Immigrants | Ghana | 0.3 /100 | #263 | Tragic 91.2% |
| Yup'ik | 0.3 /100 | #264 | Tragic 91.2% |
| Pueblo | 0.3 /100 | #265 | Tragic 91.2% |
| Immigrants | Western Africa | 0.3 /100 | #266 | Tragic 91.2% |
| Immigrants | Jamaica | 0.3 /100 | #267 | Tragic 91.2% |
| U.S. Virgin Islanders | 0.2 /100 | #268 | Tragic 91.1% |
| Ute | 0.2 /100 | #269 | Tragic 91.1% |
| Trinidadians and Tobagonians | 0.2 /100 | #270 | Tragic 91.1% |
| Immigrants | Peru | 0.1 /100 | #271 | Tragic 91.0% |
| West Indians | 0.1 /100 | #272 | Tragic 91.0% |
| Paiute | 0.1 /100 | #273 | Tragic 91.0% |