Immigrants from Israel vs Immigrants from Central America 3rd Grade
COMPARE
Immigrants from Israel
Immigrants from Central America
3rd Grade
3rd Grade Comparison
Immigrants from Israel
Immigrants from Central America
97.9%
3RD GRADE
77.3/ 100
METRIC RATING
147th/ 347
METRIC RANK
95.8%
3RD GRADE
0.0/ 100
METRIC RATING
341st/ 347
METRIC RANK
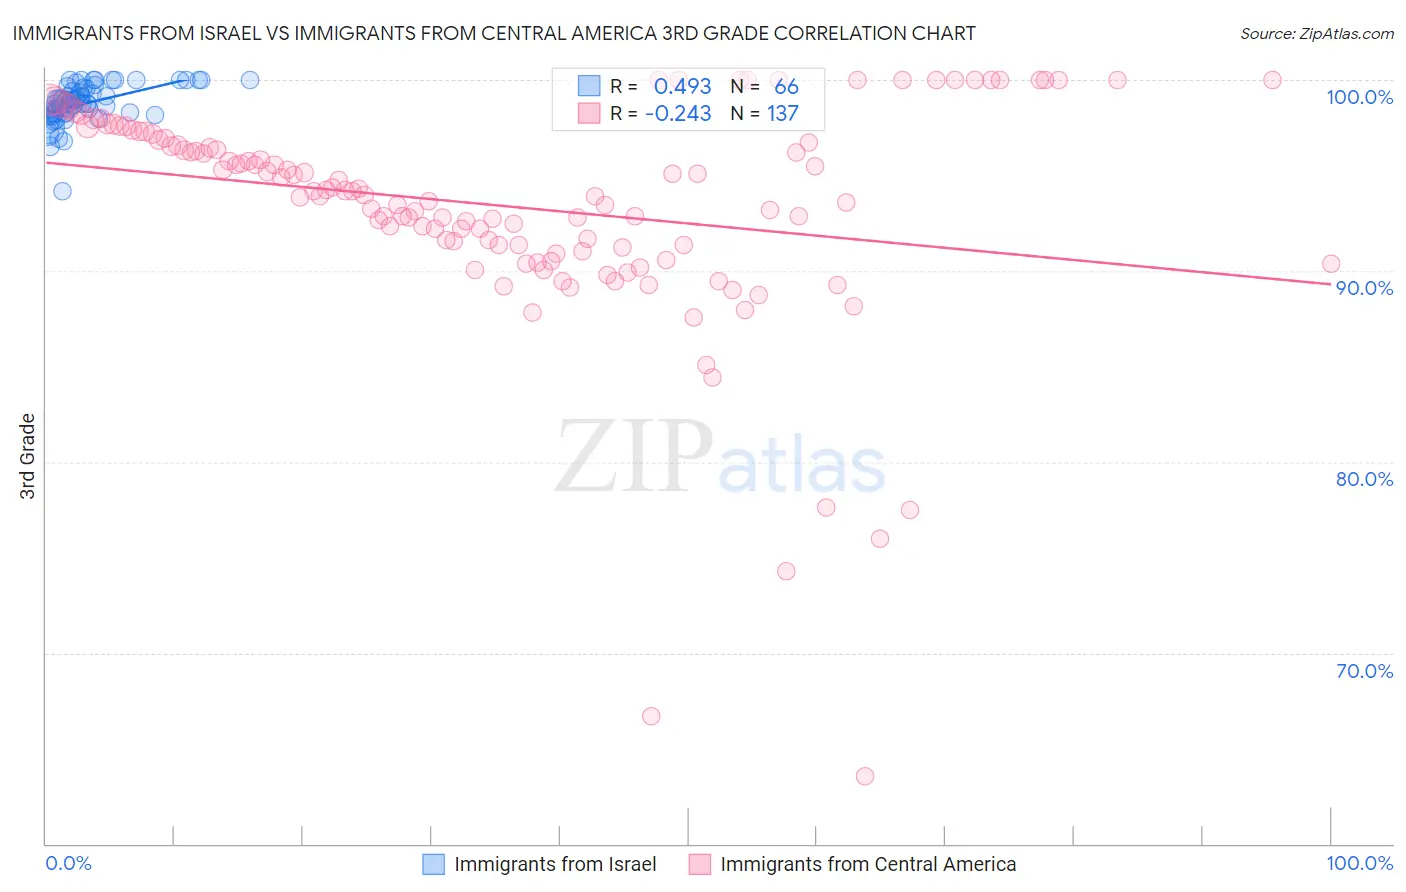
Immigrants from Israel vs Immigrants from Central America 3rd Grade Correlation Chart
The statistical analysis conducted on geographies consisting of 210,029,773 people shows a moderate positive correlation between the proportion of Immigrants from Israel and percentage of population with at least 3rd grade education in the United States with a correlation coefficient (R) of 0.493 and weighted average of 97.9%. Similarly, the statistical analysis conducted on geographies consisting of 536,554,494 people shows a weak negative correlation between the proportion of Immigrants from Central America and percentage of population with at least 3rd grade education in the United States with a correlation coefficient (R) of -0.243 and weighted average of 95.8%, a difference of 2.1%.
3rd Grade Correlation Summary
| Measurement | Immigrants from Israel | Immigrants from Central America |
| Minimum | 94.1% | 63.5% |
| Maximum | 100.0% | 100.0% |
| Range | 5.9% | 36.5% |
| Mean | 98.8% | 93.4% |
| Median | 98.8% | 94.2% |
| Interquartile 25% (IQ1) | 98.3% | 91.3% |
| Interquartile 75% (IQ3) | 99.5% | 97.1% |
| Interquartile Range (IQR) | 1.3% | 5.8% |
| Standard Deviation (Sample) | 1.0% | 5.8% |
| Standard Deviation (Population) | 1.0% | 5.8% |
Similar Demographics by 3rd Grade
Demographics Similar to Immigrants from Israel by 3rd Grade
In terms of 3rd grade, the demographic groups most similar to Immigrants from Israel are Alsatian (97.9%, a difference of 0.0%), Immigrants from Moldova (97.9%, a difference of 0.0%), Filipino (97.9%, a difference of 0.010%), Burmese (97.9%, a difference of 0.010%), and Immigrants from Greece (97.9%, a difference of 0.010%).
| Demographics | Rating | Rank | 3rd Grade |
| Palestinians | 84.6 /100 | #140 | Excellent 97.9% |
| Immigrants | Turkey | 83.5 /100 | #141 | Excellent 97.9% |
| Hmong | 80.3 /100 | #142 | Excellent 97.9% |
| Filipinos | 79.9 /100 | #143 | Good 97.9% |
| Burmese | 79.6 /100 | #144 | Good 97.9% |
| Immigrants | Greece | 79.5 /100 | #145 | Good 97.9% |
| Alsatians | 78.3 /100 | #146 | Good 97.9% |
| Immigrants | Israel | 77.3 /100 | #147 | Good 97.9% |
| Immigrants | Moldova | 77.1 /100 | #148 | Good 97.9% |
| Immigrants | North Macedonia | 74.5 /100 | #149 | Good 97.8% |
| Jordanians | 74.5 /100 | #150 | Good 97.8% |
| Soviet Union | 72.6 /100 | #151 | Good 97.8% |
| Immigrants | South Central Asia | 69.5 /100 | #152 | Good 97.8% |
| Apache | 68.5 /100 | #153 | Good 97.8% |
| Immigrants | Eastern Europe | 64.1 /100 | #154 | Good 97.8% |
Demographics Similar to Immigrants from Central America by 3rd Grade
In terms of 3rd grade, the demographic groups most similar to Immigrants from Central America are Immigrants from Guatemala (95.8%, a difference of 0.0%), Immigrants from Mexico (95.8%, a difference of 0.040%), Nepalese (95.9%, a difference of 0.060%), Yakama (95.9%, a difference of 0.13%), and Salvadoran (95.7%, a difference of 0.14%).
| Demographics | Rating | Rank | 3rd Grade |
| Immigrants | Fiji | 0.0 /100 | #333 | Tragic 96.2% |
| Immigrants | Cambodia | 0.0 /100 | #334 | Tragic 96.2% |
| Immigrants | Dominican Republic | 0.0 /100 | #335 | Tragic 96.2% |
| Immigrants | Cabo Verde | 0.0 /100 | #336 | Tragic 96.2% |
| Central Americans | 0.0 /100 | #337 | Tragic 96.1% |
| Guatemalans | 0.0 /100 | #338 | Tragic 96.0% |
| Yakama | 0.0 /100 | #339 | Tragic 95.9% |
| Nepalese | 0.0 /100 | #340 | Tragic 95.9% |
| Immigrants | Central America | 0.0 /100 | #341 | Tragic 95.8% |
| Immigrants | Guatemala | 0.0 /100 | #342 | Tragic 95.8% |
| Immigrants | Mexico | 0.0 /100 | #343 | Tragic 95.8% |
| Salvadorans | 0.0 /100 | #344 | Tragic 95.7% |
| Immigrants | Yemen | 0.0 /100 | #345 | Tragic 95.6% |
| Immigrants | El Salvador | 0.0 /100 | #346 | Tragic 95.5% |
| Spanish American Indians | 0.0 /100 | #347 | Tragic 95.3% |