Immigrants from Israel vs Assyrian/Chaldean/Syriac 3rd Grade
COMPARE
Immigrants from Israel
Assyrian/Chaldean/Syriac
3rd Grade
3rd Grade Comparison
Immigrants from Israel
Assyrians/Chaldeans/Syriacs
97.9%
3RD GRADE
77.3/ 100
METRIC RATING
147th/ 347
METRIC RANK
97.4%
3RD GRADE
1.0/ 100
METRIC RATING
247th/ 347
METRIC RANK
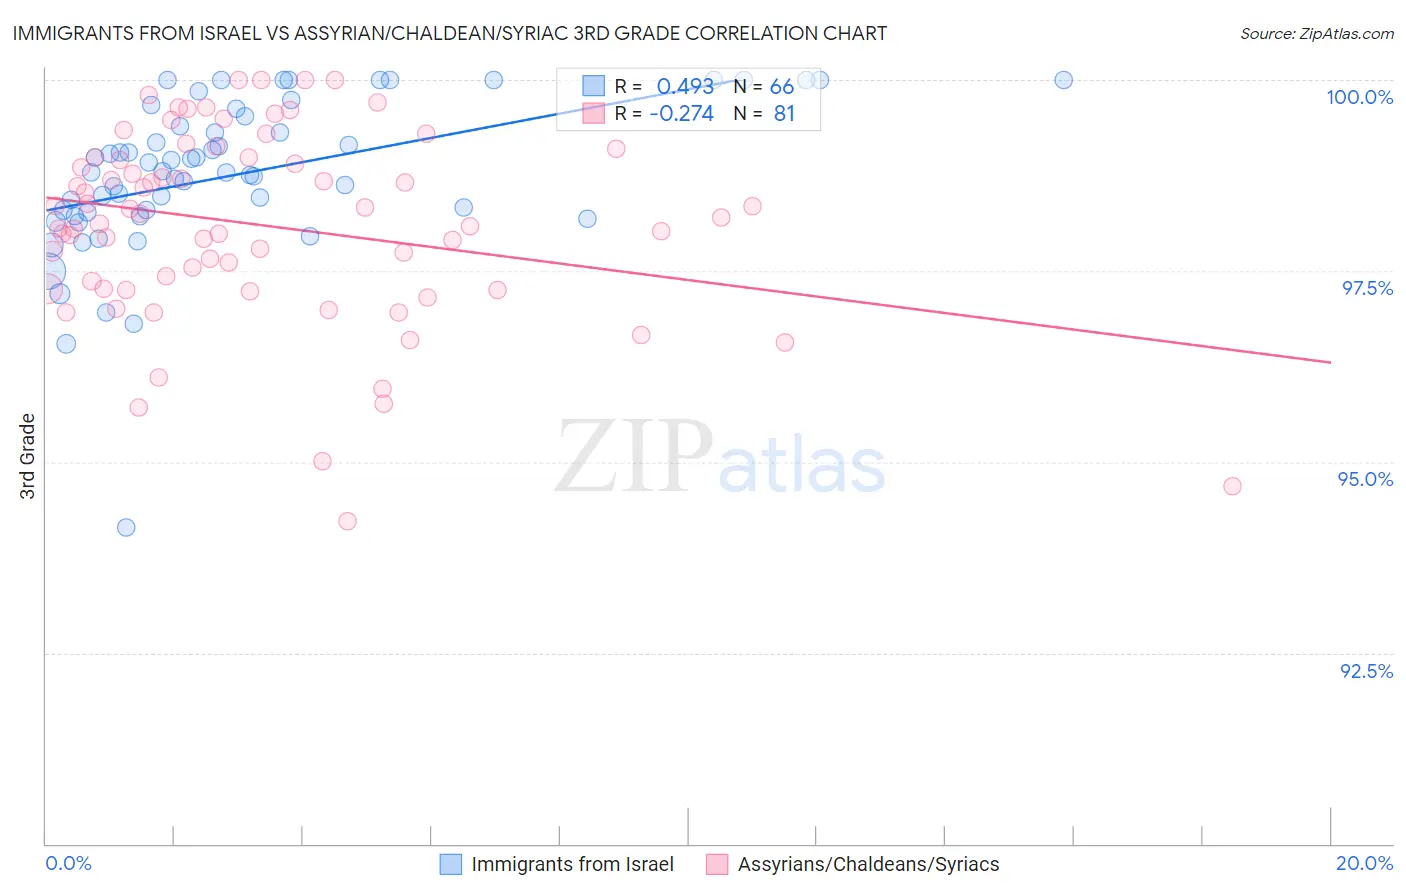
Immigrants from Israel vs Assyrian/Chaldean/Syriac 3rd Grade Correlation Chart
The statistical analysis conducted on geographies consisting of 210,029,773 people shows a moderate positive correlation between the proportion of Immigrants from Israel and percentage of population with at least 3rd grade education in the United States with a correlation coefficient (R) of 0.493 and weighted average of 97.9%. Similarly, the statistical analysis conducted on geographies consisting of 110,318,304 people shows a weak negative correlation between the proportion of Assyrians/Chaldeans/Syriacs and percentage of population with at least 3rd grade education in the United States with a correlation coefficient (R) of -0.274 and weighted average of 97.4%, a difference of 0.50%.
3rd Grade Correlation Summary
| Measurement | Immigrants from Israel | Assyrian/Chaldean/Syriac |
| Minimum | 94.1% | 94.2% |
| Maximum | 100.0% | 100.0% |
| Range | 5.9% | 5.8% |
| Mean | 98.8% | 98.1% |
| Median | 98.8% | 98.2% |
| Interquartile 25% (IQ1) | 98.3% | 97.3% |
| Interquartile 75% (IQ3) | 99.5% | 99.0% |
| Interquartile Range (IQR) | 1.3% | 1.7% |
| Standard Deviation (Sample) | 1.0% | 1.3% |
| Standard Deviation (Population) | 1.0% | 1.2% |
Similar Demographics by 3rd Grade
Demographics Similar to Immigrants from Israel by 3rd Grade
In terms of 3rd grade, the demographic groups most similar to Immigrants from Israel are Alsatian (97.9%, a difference of 0.0%), Immigrants from Moldova (97.9%, a difference of 0.0%), Filipino (97.9%, a difference of 0.010%), Burmese (97.9%, a difference of 0.010%), and Immigrants from Greece (97.9%, a difference of 0.010%).
| Demographics | Rating | Rank | 3rd Grade |
| Palestinians | 84.6 /100 | #140 | Excellent 97.9% |
| Immigrants | Turkey | 83.5 /100 | #141 | Excellent 97.9% |
| Hmong | 80.3 /100 | #142 | Excellent 97.9% |
| Filipinos | 79.9 /100 | #143 | Good 97.9% |
| Burmese | 79.6 /100 | #144 | Good 97.9% |
| Immigrants | Greece | 79.5 /100 | #145 | Good 97.9% |
| Alsatians | 78.3 /100 | #146 | Good 97.9% |
| Immigrants | Israel | 77.3 /100 | #147 | Good 97.9% |
| Immigrants | Moldova | 77.1 /100 | #148 | Good 97.9% |
| Immigrants | North Macedonia | 74.5 /100 | #149 | Good 97.8% |
| Jordanians | 74.5 /100 | #150 | Good 97.8% |
| Soviet Union | 72.6 /100 | #151 | Good 97.8% |
| Immigrants | South Central Asia | 69.5 /100 | #152 | Good 97.8% |
| Apache | 68.5 /100 | #153 | Good 97.8% |
| Immigrants | Eastern Europe | 64.1 /100 | #154 | Good 97.8% |
Demographics Similar to Assyrians/Chaldeans/Syriacs by 3rd Grade
In terms of 3rd grade, the demographic groups most similar to Assyrians/Chaldeans/Syriacs are Immigrants from Senegal (97.4%, a difference of 0.0%), Immigrants from Eastern Africa (97.4%, a difference of 0.0%), Asian (97.4%, a difference of 0.010%), Ethiopian (97.4%, a difference of 0.010%), and South American (97.4%, a difference of 0.010%).
| Demographics | Rating | Rank | 3rd Grade |
| U.S. Virgin Islanders | 1.4 /100 | #240 | Tragic 97.4% |
| Immigrants | Indonesia | 1.4 /100 | #241 | Tragic 97.4% |
| Koreans | 1.3 /100 | #242 | Tragic 97.4% |
| Indians (Asian) | 1.3 /100 | #243 | Tragic 97.4% |
| Asians | 1.1 /100 | #244 | Tragic 97.4% |
| Ethiopians | 1.1 /100 | #245 | Tragic 97.4% |
| Immigrants | Senegal | 1.0 /100 | #246 | Tragic 97.4% |
| Assyrians/Chaldeans/Syriacs | 1.0 /100 | #247 | Tragic 97.4% |
| Immigrants | Eastern Africa | 0.9 /100 | #248 | Tragic 97.4% |
| South Americans | 0.9 /100 | #249 | Tragic 97.4% |
| Immigrants | Middle Africa | 0.9 /100 | #250 | Tragic 97.4% |
| Immigrants | Asia | 0.8 /100 | #251 | Tragic 97.4% |
| Peruvians | 0.8 /100 | #252 | Tragic 97.4% |
| Immigrants | Africa | 0.8 /100 | #253 | Tragic 97.4% |
| Jamaicans | 0.7 /100 | #254 | Tragic 97.4% |