Immigrants from Germany vs Immigrants from Central America 3rd Grade
COMPARE
Immigrants from Germany
Immigrants from Central America
3rd Grade
3rd Grade Comparison
Immigrants from Germany
Immigrants from Central America
98.1%
3RD GRADE
98.4/ 100
METRIC RATING
94th/ 347
METRIC RANK
95.8%
3RD GRADE
0.0/ 100
METRIC RATING
341st/ 347
METRIC RANK
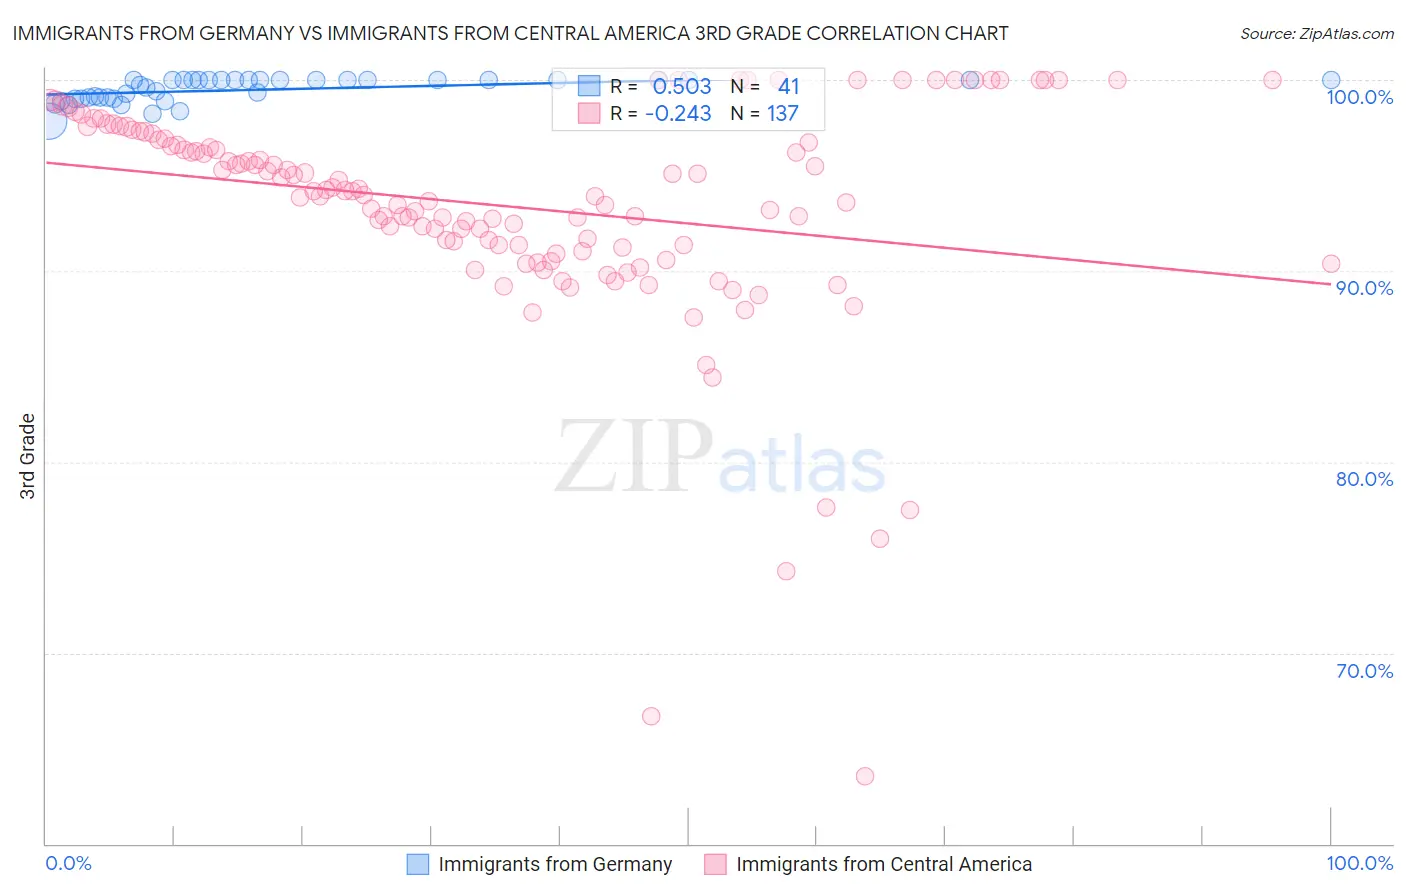
Immigrants from Germany vs Immigrants from Central America 3rd Grade Correlation Chart
The statistical analysis conducted on geographies consisting of 463,886,643 people shows a substantial positive correlation between the proportion of Immigrants from Germany and percentage of population with at least 3rd grade education in the United States with a correlation coefficient (R) of 0.503 and weighted average of 98.1%. Similarly, the statistical analysis conducted on geographies consisting of 536,554,494 people shows a weak negative correlation between the proportion of Immigrants from Central America and percentage of population with at least 3rd grade education in the United States with a correlation coefficient (R) of -0.243 and weighted average of 95.8%, a difference of 2.4%.
3rd Grade Correlation Summary
| Measurement | Immigrants from Germany | Immigrants from Central America |
| Minimum | 97.8% | 63.5% |
| Maximum | 100.0% | 100.0% |
| Range | 2.2% | 36.5% |
| Mean | 99.5% | 93.4% |
| Median | 100.0% | 94.2% |
| Interquartile 25% (IQ1) | 99.0% | 91.3% |
| Interquartile 75% (IQ3) | 100.0% | 97.1% |
| Interquartile Range (IQR) | 0.96% | 5.8% |
| Standard Deviation (Sample) | 0.61% | 5.8% |
| Standard Deviation (Population) | 0.60% | 5.8% |
Similar Demographics by 3rd Grade
Demographics Similar to Immigrants from Germany by 3rd Grade
In terms of 3rd grade, the demographic groups most similar to Immigrants from Germany are Cypriot (98.1%, a difference of 0.0%), Immigrants from Ireland (98.1%, a difference of 0.010%), South African (98.1%, a difference of 0.010%), Delaware (98.1%, a difference of 0.020%), and Zimbabwean (98.1%, a difference of 0.020%).
| Demographics | Rating | Rank | 3rd Grade |
| Immigrants | Denmark | 98.8 /100 | #87 | Exceptional 98.1% |
| Immigrants | India | 98.8 /100 | #88 | Exceptional 98.1% |
| Delaware | 98.8 /100 | #89 | Exceptional 98.1% |
| Zimbabweans | 98.8 /100 | #90 | Exceptional 98.1% |
| Hopi | 98.7 /100 | #91 | Exceptional 98.1% |
| Immigrants | South Africa | 98.7 /100 | #92 | Exceptional 98.1% |
| Immigrants | Western Europe | 98.7 /100 | #93 | Exceptional 98.1% |
| Immigrants | Germany | 98.4 /100 | #94 | Exceptional 98.1% |
| Cypriots | 98.4 /100 | #95 | Exceptional 98.1% |
| Immigrants | Ireland | 98.2 /100 | #96 | Exceptional 98.1% |
| South Africans | 98.2 /100 | #97 | Exceptional 98.1% |
| Choctaw | 98.0 /100 | #98 | Exceptional 98.1% |
| Romanians | 98.0 /100 | #99 | Exceptional 98.1% |
| Cree | 97.9 /100 | #100 | Exceptional 98.1% |
| Puget Sound Salish | 97.9 /100 | #101 | Exceptional 98.1% |
Demographics Similar to Immigrants from Central America by 3rd Grade
In terms of 3rd grade, the demographic groups most similar to Immigrants from Central America are Immigrants from Guatemala (95.8%, a difference of 0.0%), Immigrants from Mexico (95.8%, a difference of 0.040%), Nepalese (95.9%, a difference of 0.060%), Yakama (95.9%, a difference of 0.13%), and Salvadoran (95.7%, a difference of 0.14%).
| Demographics | Rating | Rank | 3rd Grade |
| Immigrants | Fiji | 0.0 /100 | #333 | Tragic 96.2% |
| Immigrants | Cambodia | 0.0 /100 | #334 | Tragic 96.2% |
| Immigrants | Dominican Republic | 0.0 /100 | #335 | Tragic 96.2% |
| Immigrants | Cabo Verde | 0.0 /100 | #336 | Tragic 96.2% |
| Central Americans | 0.0 /100 | #337 | Tragic 96.1% |
| Guatemalans | 0.0 /100 | #338 | Tragic 96.0% |
| Yakama | 0.0 /100 | #339 | Tragic 95.9% |
| Nepalese | 0.0 /100 | #340 | Tragic 95.9% |
| Immigrants | Central America | 0.0 /100 | #341 | Tragic 95.8% |
| Immigrants | Guatemala | 0.0 /100 | #342 | Tragic 95.8% |
| Immigrants | Mexico | 0.0 /100 | #343 | Tragic 95.8% |
| Salvadorans | 0.0 /100 | #344 | Tragic 95.7% |
| Immigrants | Yemen | 0.0 /100 | #345 | Tragic 95.6% |
| Immigrants | El Salvador | 0.0 /100 | #346 | Tragic 95.5% |
| Spanish American Indians | 0.0 /100 | #347 | Tragic 95.3% |