Immigrants from Iran vs Immigrants from Hungary 11th Grade
COMPARE
Immigrants from Iran
Immigrants from Hungary
11th Grade
11th Grade Comparison
Immigrants from Iran
Immigrants from Hungary
93.5%
11TH GRADE
98.9/ 100
METRIC RATING
97th/ 347
METRIC RANK
93.4%
11TH GRADE
97.5/ 100
METRIC RATING
116th/ 347
METRIC RANK
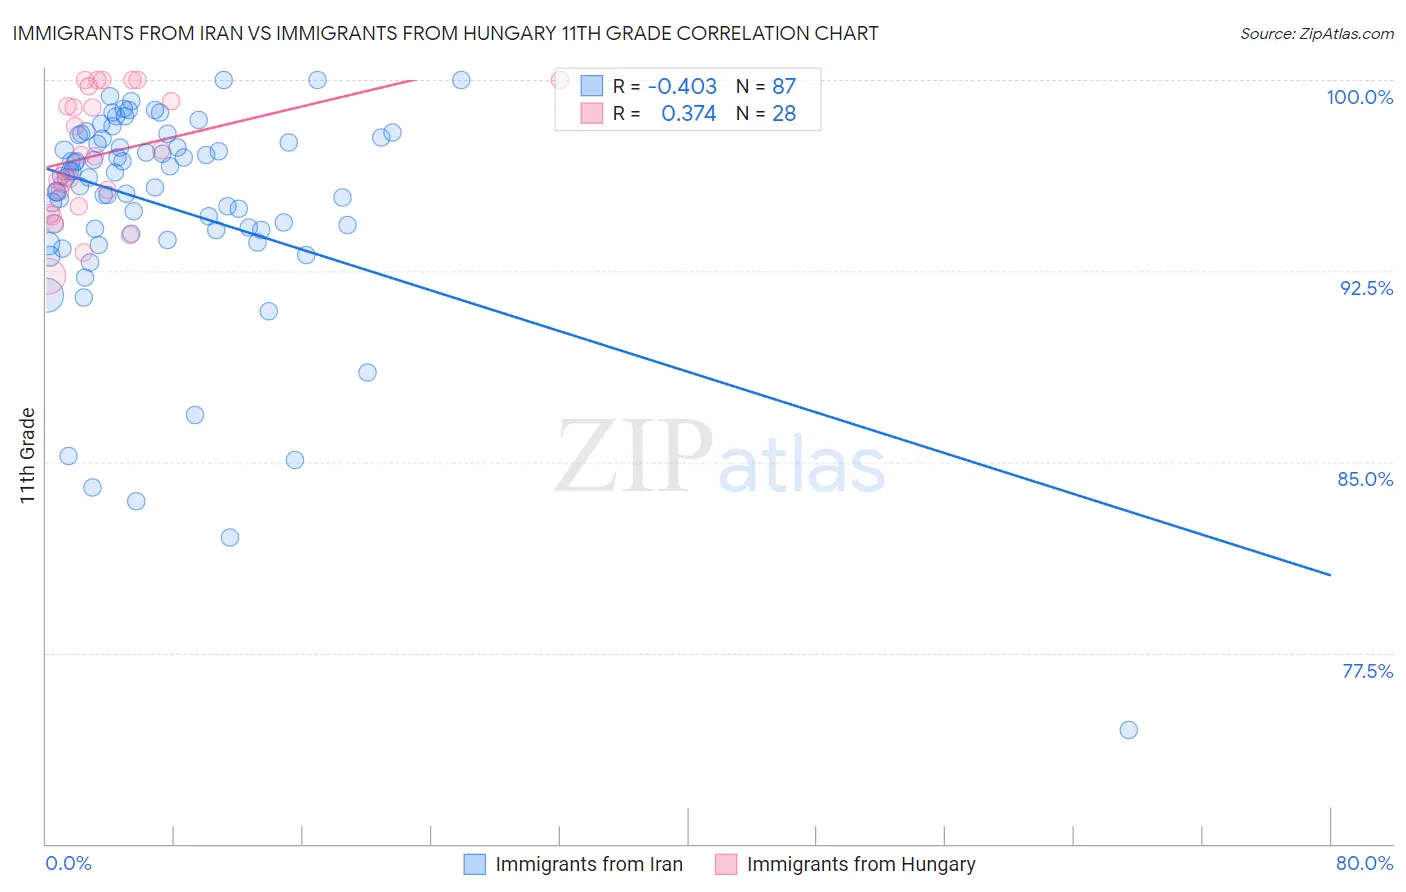
Immigrants from Iran vs Immigrants from Hungary 11th Grade Correlation Chart
The statistical analysis conducted on geographies consisting of 279,905,207 people shows a moderate negative correlation between the proportion of Immigrants from Iran and percentage of population with at least 11th grade education in the United States with a correlation coefficient (R) of -0.403 and weighted average of 93.5%. Similarly, the statistical analysis conducted on geographies consisting of 195,707,305 people shows a mild positive correlation between the proportion of Immigrants from Hungary and percentage of population with at least 11th grade education in the United States with a correlation coefficient (R) of 0.374 and weighted average of 93.4%, a difference of 0.19%.
11th Grade Correlation Summary
| Measurement | Immigrants from Iran | Immigrants from Hungary |
| Minimum | 74.5% | 92.3% |
| Maximum | 100.0% | 100.0% |
| Range | 25.5% | 7.7% |
| Mean | 95.0% | 97.1% |
| Median | 96.2% | 97.0% |
| Interquartile 25% (IQ1) | 94.1% | 95.4% |
| Interquartile 75% (IQ3) | 97.7% | 99.5% |
| Interquartile Range (IQR) | 3.6% | 4.1% |
| Standard Deviation (Sample) | 4.3% | 2.4% |
| Standard Deviation (Population) | 4.3% | 2.3% |
Demographics Similar to Immigrants from Iran and Immigrants from Hungary by 11th Grade
In terms of 11th grade, the demographic groups most similar to Immigrants from Iran are Immigrants from Turkey (93.5%, a difference of 0.010%), Immigrants from Israel (93.5%, a difference of 0.020%), Menominee (93.5%, a difference of 0.020%), Immigrants from North Macedonia (93.5%, a difference of 0.030%), and Immigrants from Romania (93.5%, a difference of 0.040%). Similarly, the demographic groups most similar to Immigrants from Hungary are Palestinian (93.4%, a difference of 0.020%), Immigrants from Zimbabwe (93.4%, a difference of 0.030%), Jordanian (93.4%, a difference of 0.030%), Immigrants from Germany (93.4%, a difference of 0.060%), and Yugoslavian (93.4%, a difference of 0.070%).
| Demographics | Rating | Rank | 11th Grade |
| Immigrants | Turkey | 98.9 /100 | #96 | Exceptional 93.5% |
| Immigrants | Iran | 98.9 /100 | #97 | Exceptional 93.5% |
| Immigrants | Israel | 98.8 /100 | #98 | Exceptional 93.5% |
| Menominee | 98.7 /100 | #99 | Exceptional 93.5% |
| Immigrants | North Macedonia | 98.7 /100 | #100 | Exceptional 93.5% |
| Immigrants | Romania | 98.7 /100 | #101 | Exceptional 93.5% |
| Chippewa | 98.6 /100 | #102 | Exceptional 93.5% |
| Lebanese | 98.6 /100 | #103 | Exceptional 93.5% |
| Immigrants | Europe | 98.6 /100 | #104 | Exceptional 93.5% |
| Immigrants | Serbia | 98.6 /100 | #105 | Exceptional 93.5% |
| Immigrants | Croatia | 98.6 /100 | #106 | Exceptional 93.5% |
| Immigrants | Norway | 98.4 /100 | #107 | Exceptional 93.5% |
| Alaska Natives | 98.4 /100 | #108 | Exceptional 93.5% |
| Immigrants | Kuwait | 98.4 /100 | #109 | Exceptional 93.5% |
| Syrians | 98.4 /100 | #110 | Exceptional 93.4% |
| Yugoslavians | 98.1 /100 | #111 | Exceptional 93.4% |
| Immigrants | Germany | 98.0 /100 | #112 | Exceptional 93.4% |
| Immigrants | Zimbabwe | 97.8 /100 | #113 | Exceptional 93.4% |
| Jordanians | 97.8 /100 | #114 | Exceptional 93.4% |
| Palestinians | 97.7 /100 | #115 | Exceptional 93.4% |
| Immigrants | Hungary | 97.5 /100 | #116 | Exceptional 93.4% |