Immigrants from Zaire vs Lebanese 7th Grade
COMPARE
Immigrants from Zaire
Lebanese
7th Grade
7th Grade Comparison
Immigrants from Zaire
Lebanese
95.9%
7TH GRADE
26.7/ 100
METRIC RATING
197th/ 347
METRIC RANK
96.7%
7TH GRADE
98.8/ 100
METRIC RATING
94th/ 347
METRIC RANK
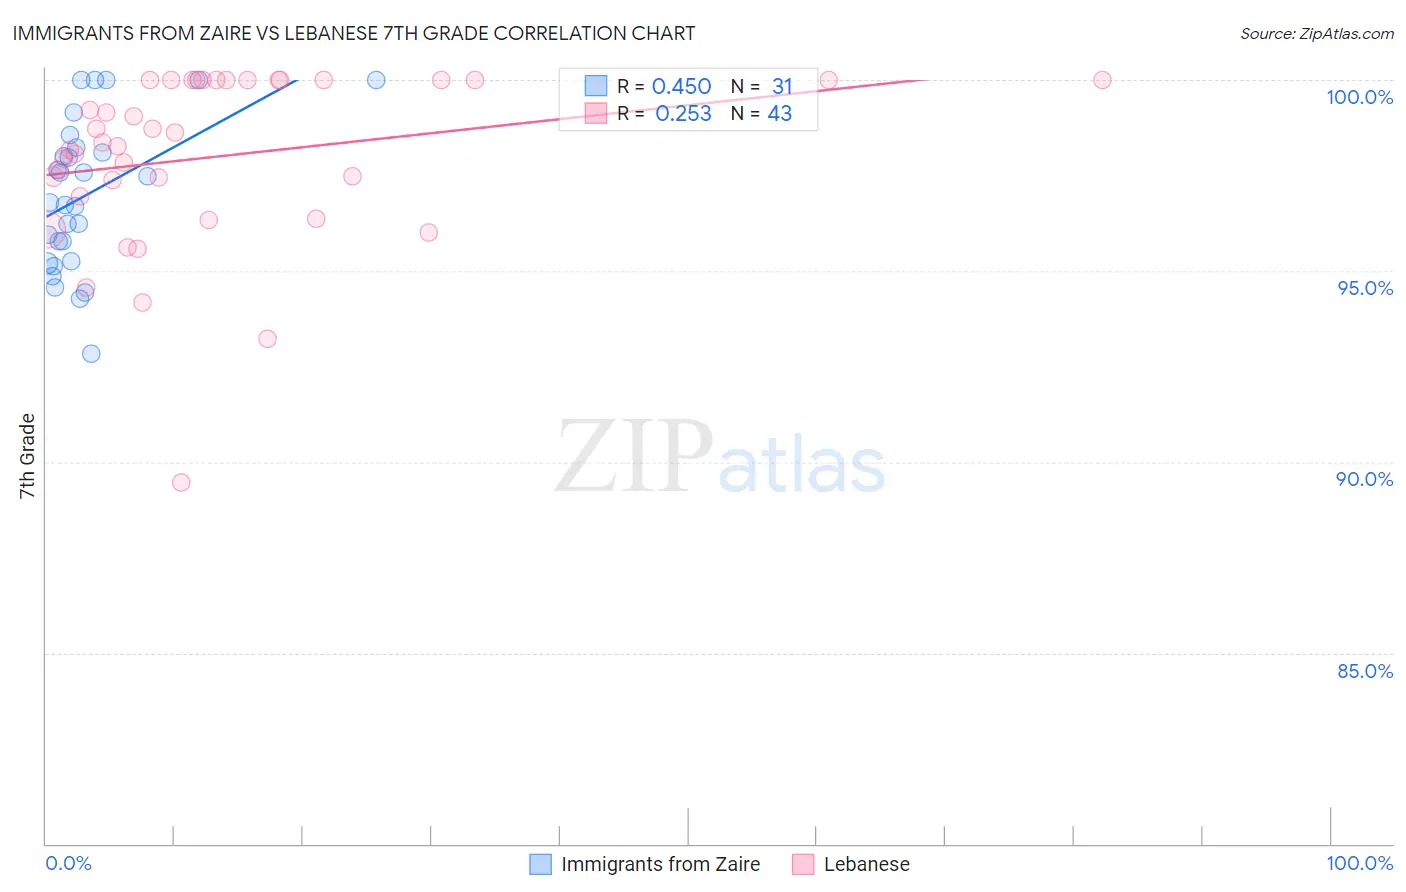
Immigrants from Zaire vs Lebanese 7th Grade Correlation Chart
The statistical analysis conducted on geographies consisting of 107,212,695 people shows a moderate positive correlation between the proportion of Immigrants from Zaire and percentage of population with at least 7th grade education in the United States with a correlation coefficient (R) of 0.450 and weighted average of 95.9%. Similarly, the statistical analysis conducted on geographies consisting of 401,571,113 people shows a weak positive correlation between the proportion of Lebanese and percentage of population with at least 7th grade education in the United States with a correlation coefficient (R) of 0.253 and weighted average of 96.7%, a difference of 0.83%.
7th Grade Correlation Summary
| Measurement | Immigrants from Zaire | Lebanese |
| Minimum | 92.8% | 89.5% |
| Maximum | 100.0% | 100.0% |
| Range | 7.2% | 10.5% |
| Mean | 97.0% | 98.0% |
| Median | 96.8% | 98.4% |
| Interquartile 25% (IQ1) | 95.2% | 97.0% |
| Interquartile 75% (IQ3) | 98.2% | 100.0% |
| Interquartile Range (IQR) | 3.0% | 3.0% |
| Standard Deviation (Sample) | 2.0% | 2.3% |
| Standard Deviation (Population) | 1.9% | 2.2% |
Similar Demographics by 7th Grade
Demographics Similar to Immigrants from Zaire by 7th Grade
In terms of 7th grade, the demographic groups most similar to Immigrants from Zaire are Sudanese (95.9%, a difference of 0.010%), Apache (95.9%, a difference of 0.010%), Immigrants from Nepal (95.9%, a difference of 0.020%), Paraguayan (95.9%, a difference of 0.020%), and Immigrants from Bahamas (95.9%, a difference of 0.030%).
| Demographics | Rating | Rank | 7th Grade |
| Immigrants | Micronesia | 32.6 /100 | #190 | Fair 95.9% |
| Liberians | 32.5 /100 | #191 | Fair 95.9% |
| Panamanians | 32.3 /100 | #192 | Fair 95.9% |
| Immigrants | Bahamas | 30.8 /100 | #193 | Fair 95.9% |
| Immigrants | Nepal | 30.0 /100 | #194 | Fair 95.9% |
| Sudanese | 28.1 /100 | #195 | Fair 95.9% |
| Apache | 27.6 /100 | #196 | Fair 95.9% |
| Immigrants | Zaire | 26.7 /100 | #197 | Fair 95.9% |
| Paraguayans | 24.8 /100 | #198 | Fair 95.9% |
| Guamanians/Chamorros | 23.5 /100 | #199 | Fair 95.9% |
| Argentineans | 23.2 /100 | #200 | Fair 95.9% |
| Immigrants | Argentina | 21.9 /100 | #201 | Fair 95.9% |
| Immigrants | Northern Africa | 21.4 /100 | #202 | Fair 95.8% |
| Comanche | 21.1 /100 | #203 | Fair 95.8% |
| Assyrians/Chaldeans/Syriacs | 20.5 /100 | #204 | Fair 95.8% |
Demographics Similar to Lebanese by 7th Grade
In terms of 7th grade, the demographic groups most similar to Lebanese are Immigrants from Australia (96.7%, a difference of 0.0%), Potawatomi (96.7%, a difference of 0.010%), Immigrants from Denmark (96.7%, a difference of 0.010%), Immigrants from South Africa (96.7%, a difference of 0.020%), and Osage (96.7%, a difference of 0.020%).
| Demographics | Rating | Rank | 7th Grade |
| Immigrants | Belgium | 99.0 /100 | #87 | Exceptional 96.7% |
| Puget Sound Salish | 99.0 /100 | #88 | Exceptional 96.7% |
| Cree | 99.0 /100 | #89 | Exceptional 96.7% |
| Immigrants | South Africa | 98.9 /100 | #90 | Exceptional 96.7% |
| Osage | 98.9 /100 | #91 | Exceptional 96.7% |
| Immigrants | Western Europe | 98.9 /100 | #92 | Exceptional 96.7% |
| Potawatomi | 98.9 /100 | #93 | Exceptional 96.7% |
| Lebanese | 98.8 /100 | #94 | Exceptional 96.7% |
| Immigrants | Australia | 98.8 /100 | #95 | Exceptional 96.7% |
| Immigrants | Denmark | 98.7 /100 | #96 | Exceptional 96.7% |
| Immigrants | Germany | 98.7 /100 | #97 | Exceptional 96.7% |
| Immigrants | Sweden | 98.7 /100 | #98 | Exceptional 96.7% |
| Menominee | 98.7 /100 | #99 | Exceptional 96.7% |
| German Russians | 98.6 /100 | #100 | Exceptional 96.7% |
| Thais | 98.6 /100 | #101 | Exceptional 96.7% |