Immigrants from Iran vs Romanian 8th Grade
COMPARE
Immigrants from Iran
Romanian
8th Grade
8th Grade Comparison
Immigrants from Iran
Romanians
95.8%
8TH GRADE
58.6/ 100
METRIC RATING
169th/ 347
METRIC RANK
96.5%
8TH GRADE
99.2/ 100
METRIC RATING
81st/ 347
METRIC RANK
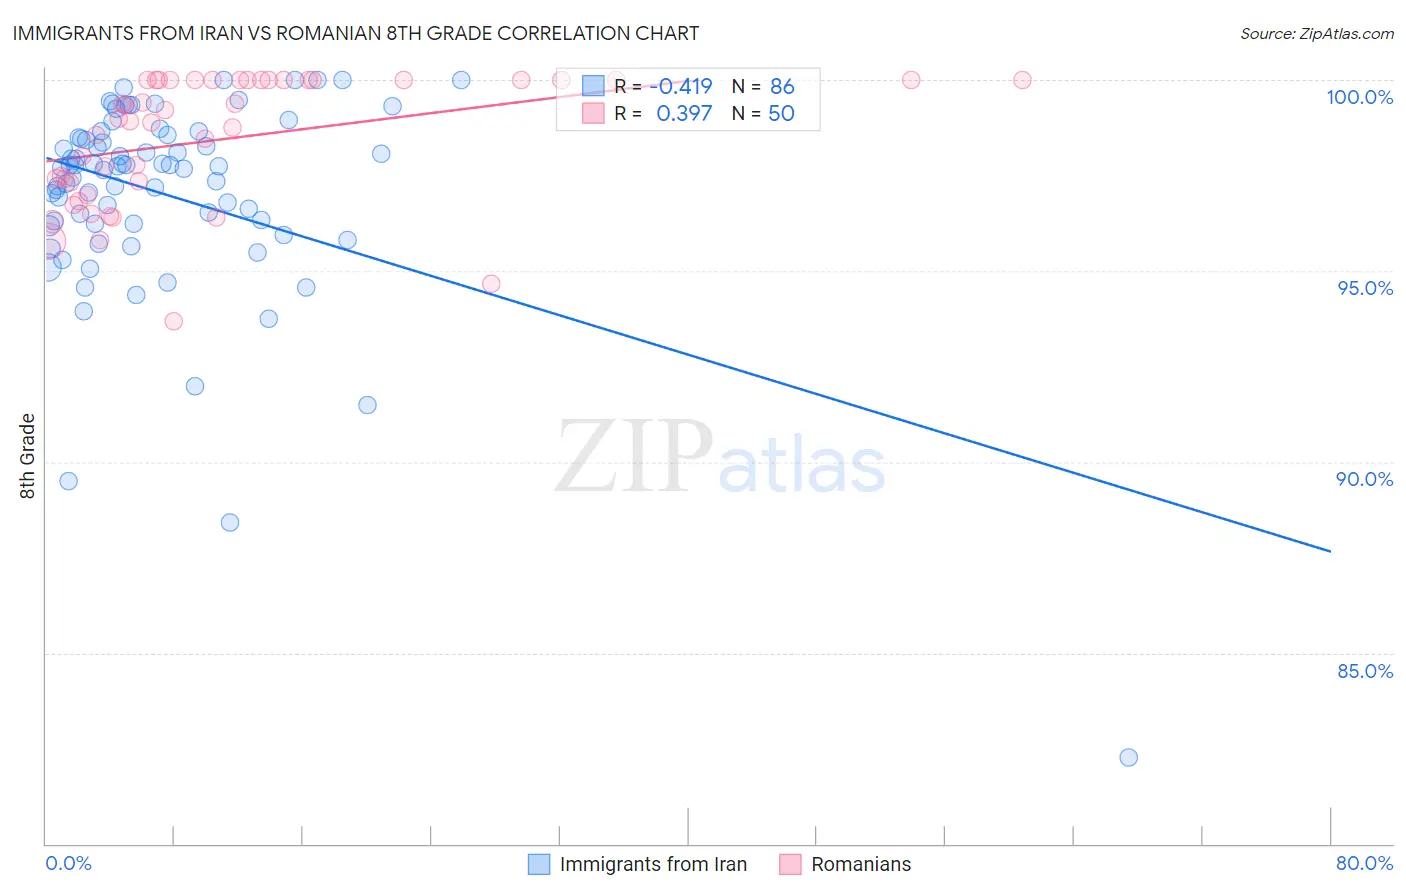
Immigrants from Iran vs Romanian 8th Grade Correlation Chart
The statistical analysis conducted on geographies consisting of 279,867,553 people shows a moderate negative correlation between the proportion of Immigrants from Iran and percentage of population with at least 8th grade education in the United States with a correlation coefficient (R) of -0.419 and weighted average of 95.8%. Similarly, the statistical analysis conducted on geographies consisting of 377,904,438 people shows a mild positive correlation between the proportion of Romanians and percentage of population with at least 8th grade education in the United States with a correlation coefficient (R) of 0.397 and weighted average of 96.5%, a difference of 0.73%.
8th Grade Correlation Summary
| Measurement | Immigrants from Iran | Romanian |
| Minimum | 82.3% | 93.7% |
| Maximum | 100.0% | 100.0% |
| Range | 17.7% | 6.3% |
| Mean | 97.0% | 98.4% |
| Median | 97.7% | 99.0% |
| Interquartile 25% (IQ1) | 96.2% | 97.3% |
| Interquartile 75% (IQ3) | 98.5% | 100.0% |
| Interquartile Range (IQR) | 2.3% | 2.7% |
| Standard Deviation (Sample) | 2.7% | 1.7% |
| Standard Deviation (Population) | 2.7% | 1.7% |
Similar Demographics by 8th Grade
Demographics Similar to Immigrants from Iran by 8th Grade
In terms of 8th grade, the demographic groups most similar to Immigrants from Iran are Ute (95.8%, a difference of 0.0%), Egyptian (95.8%, a difference of 0.0%), Immigrants from Korea (95.8%, a difference of 0.0%), Spaniard (95.8%, a difference of 0.010%), and Immigrants from Ukraine (95.8%, a difference of 0.010%).
| Demographics | Rating | Rank | 8th Grade |
| Immigrants | Kenya | 67.2 /100 | #162 | Good 95.8% |
| Immigrants | Sri Lanka | 64.1 /100 | #163 | Good 95.8% |
| Immigrants | Italy | 63.5 /100 | #164 | Good 95.8% |
| Alsatians | 61.4 /100 | #165 | Good 95.8% |
| Immigrants | Poland | 61.1 /100 | #166 | Good 95.8% |
| Spaniards | 60.0 /100 | #167 | Good 95.8% |
| Immigrants | Ukraine | 59.5 /100 | #168 | Average 95.8% |
| Immigrants | Iran | 58.6 /100 | #169 | Average 95.8% |
| Ute | 58.5 /100 | #170 | Average 95.8% |
| Egyptians | 58.2 /100 | #171 | Average 95.8% |
| Immigrants | Korea | 57.9 /100 | #172 | Average 95.8% |
| Mongolians | 53.0 /100 | #173 | Average 95.8% |
| Chileans | 50.0 /100 | #174 | Average 95.7% |
| Immigrants | Albania | 49.6 /100 | #175 | Average 95.7% |
| Pakistanis | 48.8 /100 | #176 | Average 95.7% |
Demographics Similar to Romanians by 8th Grade
In terms of 8th grade, the demographic groups most similar to Romanians are Delaware (96.5%, a difference of 0.0%), Turkish (96.5%, a difference of 0.0%), Icelander (96.5%, a difference of 0.010%), Puget Sound Salish (96.5%, a difference of 0.020%), and Immigrants from Belgium (96.5%, a difference of 0.020%).
| Demographics | Rating | Rank | 8th Grade |
| Immigrants | Ireland | 99.5 /100 | #74 | Exceptional 96.5% |
| Zimbabweans | 99.4 /100 | #75 | Exceptional 96.5% |
| Immigrants | Netherlands | 99.4 /100 | #76 | Exceptional 96.5% |
| Cypriots | 99.4 /100 | #77 | Exceptional 96.5% |
| Yugoslavians | 99.4 /100 | #78 | Exceptional 96.5% |
| Puget Sound Salish | 99.3 /100 | #79 | Exceptional 96.5% |
| Delaware | 99.2 /100 | #80 | Exceptional 96.5% |
| Romanians | 99.2 /100 | #81 | Exceptional 96.5% |
| Turks | 99.2 /100 | #82 | Exceptional 96.5% |
| Icelanders | 99.2 /100 | #83 | Exceptional 96.5% |
| Immigrants | Belgium | 99.1 /100 | #84 | Exceptional 96.5% |
| Immigrants | South Africa | 99.1 /100 | #85 | Exceptional 96.5% |
| Cherokee | 99.0 /100 | #86 | Exceptional 96.5% |
| Immigrants | Australia | 99.0 /100 | #87 | Exceptional 96.5% |
| Immigrants | Western Europe | 99.0 /100 | #88 | Exceptional 96.4% |